EUR/USD:
Weekly gain/loss: +1.39%
Weekly closing price: 1.2203
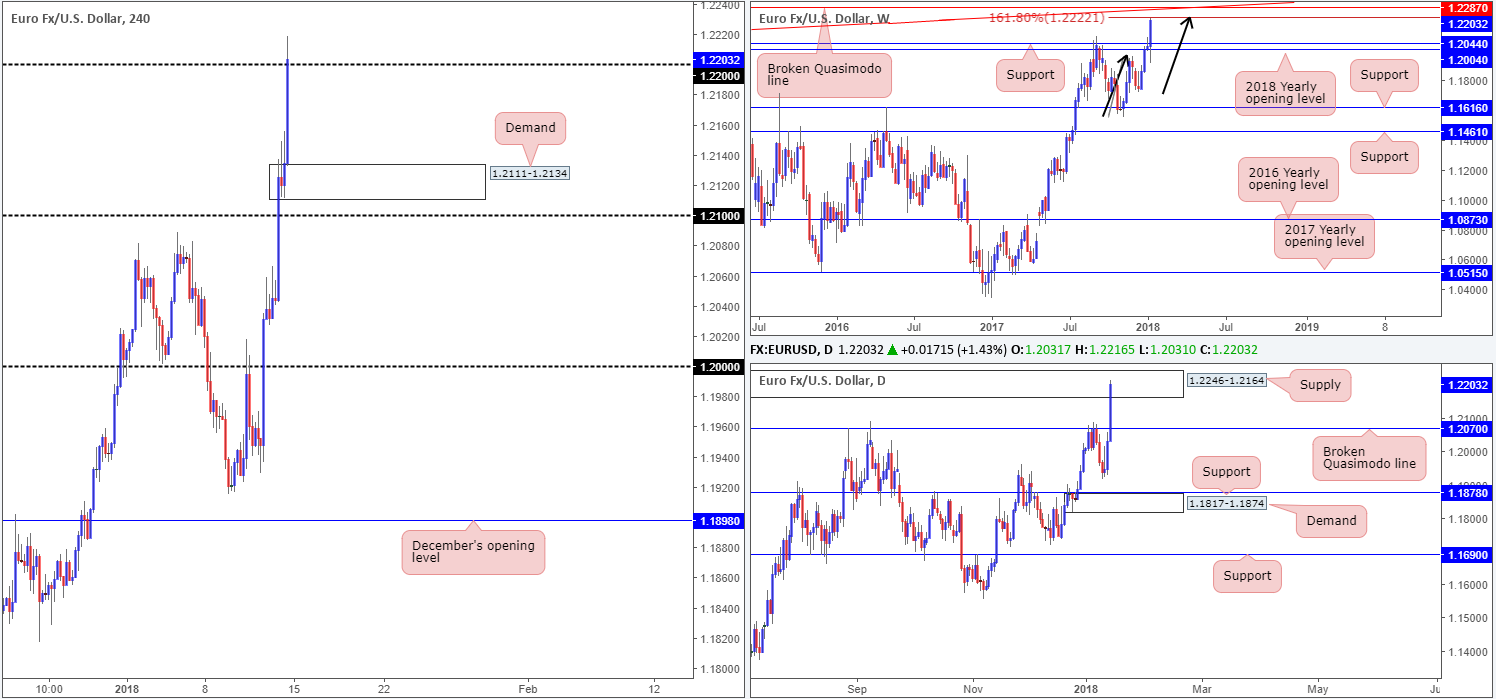
The euro was seen flexing its financial muscle once again last week, gaining over 170 pips. Weekly price crushed weekly resistance at 1.2044 (now acting support) and ended the week closing just ahead of a weekly AB=CD (black arrows) 161.8% Fib ext. point at 1.2222. Extra credibility is given to this line not only because it is situated on the weekly scale, but also since it merges closely with a weekly broken Quasimodo line at 1.2287 and a weekly trendline resistance taken from the low 1.1641.
In conjunction with weekly structure, the daily timeframe shows that price closed the week within the walls of a nice-looking supply zone drawn from 1.2246-1.2164 formed back in late 2014. Should the market rotate lower from here this week, keep an eye on the daily broken Quasimodo line seen at 1.2070. A violation of the current supply, on the other hand, would likely open up the path north to a daily broken Quasimodo line at 1.2359 (not seen on the screen).
A quick outline of Friday’s bullish move on the H4 timeframe reveals that the 1.21 handle was engulfed, allowing the unit to test and marginally close beyond the 1.22 handle. In the event that the bulls maintain a position above 1.22 this week, the next upside objective can be seen at 1.2276: a H4 broken Quasimodo line. Also worthy of note is the newly formed H4 demand base coming in at 1.2111-1.2134.
Last week’s upside move, fundamentally speaking, was likely due to the ECB delivering a set of monetary policy minutes on Thursday that bolstered a more hawkish view this year. On Friday, there were also reports that Germany’s CDU/CSU and S/D parties reached a preliminary deal on a formal coalition, further supporting the single currency.
Market direction:
With weekly price trading nearby strong-looking resistances, and daily action also seen interacting with a supply zone, the tone of this market could potentially turn sour this week.
The H4 close above 1.22, albeit marginal, should, however, still be a concern for sellers as this could indicate a move up to at least the H4 broken Quasimodo line at 1.2276. For that reason, we feel 1.2276 may be a more stable level to consider selling.
This would also lower the stop-loss distance, as the logical place for stops is above the noted daily broken Quasimodo line. Here’s why. H4 buying above 1.22 targets 1.2276. This consumes stops above daily supply and ultimately clears the way north to 1.2359. Of course, though, price may not reach this high since there is a weekly broken Quasimodo line sitting at 1.2287. Call it a CONSERVATIVE stop, if you will.
Data points to consider: No high-impacting news events on the docket; US banks closed.
Areas worthy of attention:
Supports: 1.2044; 1.2070; 1.2111-1.2134.
Resistances: 1.2287; 1.2222; weekly trendline resistance; 1.2359; 1.2246-1.2164; 1.2276.
GBP/USD:
Weekly gain/loss: +1.14%
Weekly closing price: 1.3727
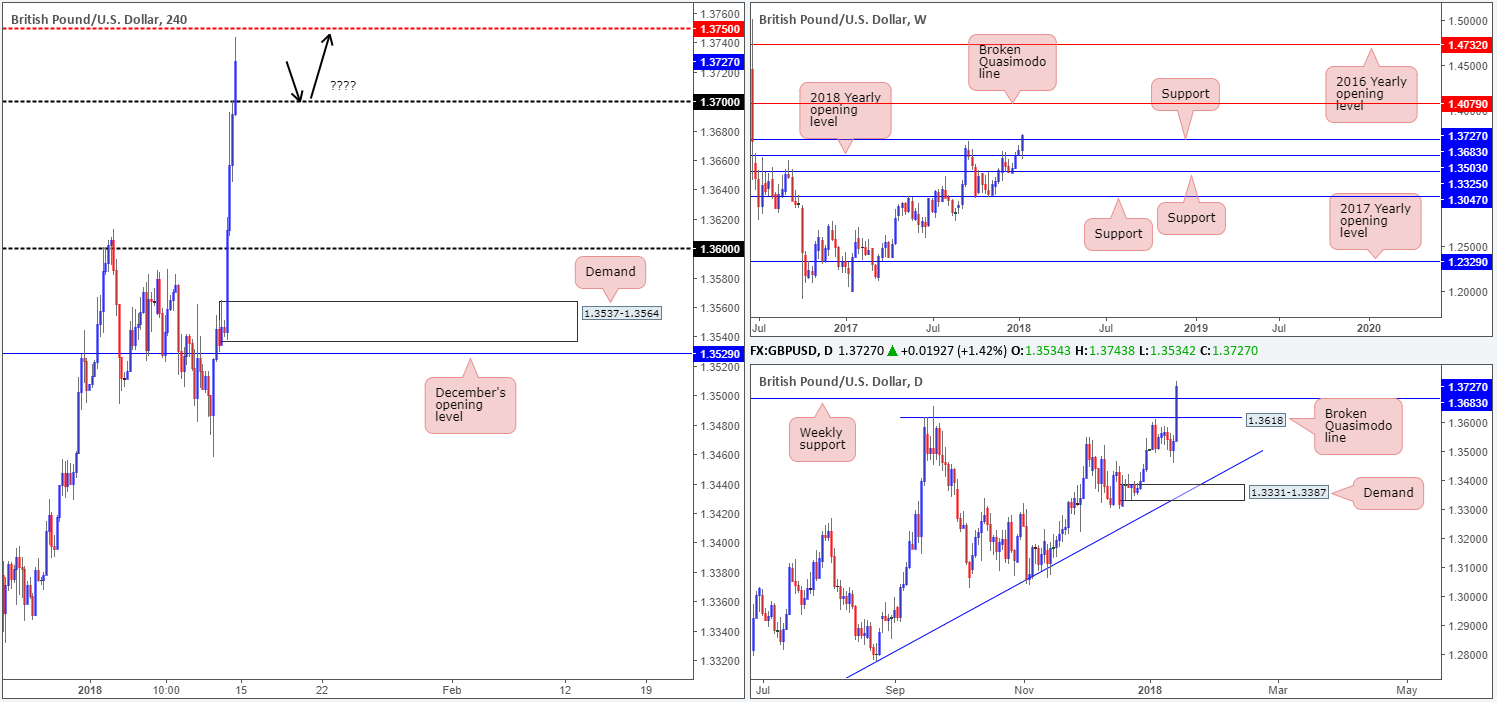
Chalking up its fourth consecutive weekly gain last week, the GBP/USD managed to overcome a major weekly resistance level at 1.3683 (now acting support) and close strongly at 1.3727. As far as we see things, the runway north is now relatively free for the bulls to stretch their legs and approach the 1.40s, specifically a weekly broken Quasimodo line at 1.4079.
Moving down to the daily timeframe, we can see that the majority of last week’s strength came from Friday’s move, following reports that Germany’s CDU/CSU and S/D parties reached a preliminary deal on a formal coalition. The break of the aforementioned weekly resistance has potentially placed a daily Quasimodo line in the firing range at 1.3878 (not seen on the screen).
Friday’s bullish move on the H4 timeframe, as you can see, took out two psychological numbers and left a nice-looking H4 demand in its wake at 1.3537-1.3564. The removal of 1.37 has placed the spotlight on the H4 mid-level resistance at 1.3750.
Market direction:
Assuming that the recent bullish move is sustained above the aforesaid weekly resistance, a retest of the 1.37 handle could be an interesting area for longs. Psychological levels such as these, however, are prone to fakeouts due to the large amount of orders they attract. This is especially true in this case since weekly support is positioned just beneath at 1.3683. As a result, waiting for H4 price to connect with 1.37 and print a full or near-full-bodied bull candle could be the way to go. Ultimately from that point, traders would need to see a decisive push above 1.3750 to confirm upside and the prospect of price reaching the higher-timeframe resistances mentioned above.
Data points to consider: MPC member Tenreyro speaks at 6.15pm; US banks closed.
Areas worthy of attention:
Supports: 1.37 handle; 1.3683.
Resistances: 1.4079; 1.3878; 1.3750.
AUD/USD:
Weekly gain/loss: +0.67%
Weekly closing price: 0.7913
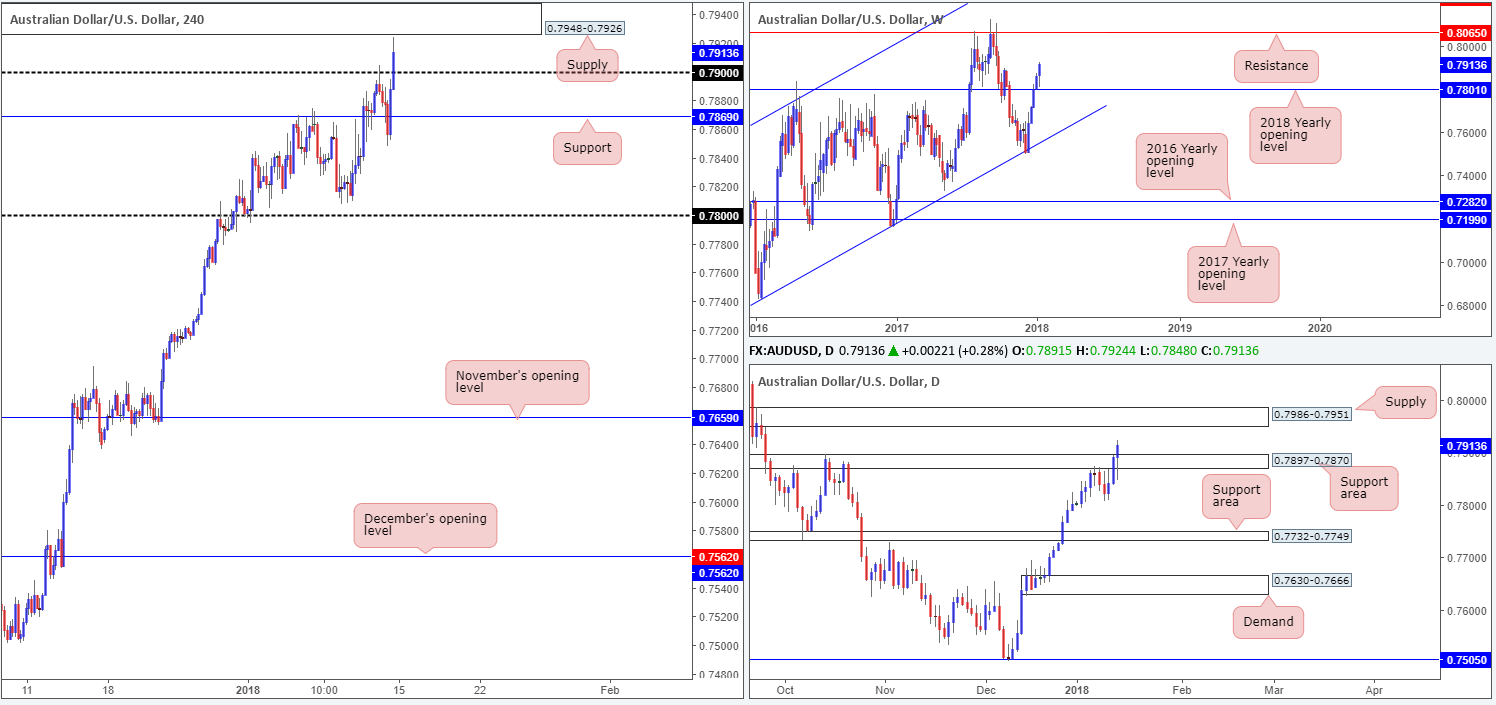
Over the last week, we can see that weekly price has begun to form a solid foundation above the 2018 yearly opening level at 0.7801, registering its fifth consecutive weekly gain. Further buying from this angle is likely to place the unit within striking distance of weekly resistance penciled in at 0.8065. This level boasts a robust history so expect active sellers to make an appearance here!
From Wednesday onward, the daily candles printed consecutive gains, eventually engulfing the nearby daily resistance area at 0.7897-0.7870 (now acting support zone). The removal of offers from this area has placed daily supply at 0.7986-0.7951 in the spotlight this week.
Across on the H4 timeframe, the pair retested support at 0.7869 on Friday for a second time this week, and strongly closed above the 0.79 handle, positioning the unit within shouting distance of a H4 supply base at 0.7948-0.7926 (located just beneath the said daily supply). Directly above this area, there’s a H4 broken Quasimodo line printed at 0.7956.
Market direction:
Although weekly action portends further buying, there’s very little space for the bulls to work with on both the daily and H4 timeframes. As such, a pullback could be on the table this week.
On account of current structure, neither a long nor short seems attractive at the moment. Buying places one in direct conflict with H4 supply, followed closely by daily supply. To the downside, one would need to contend with the nearby daily support area.
Data points to consider: No high-impacting news events on the docket; US banks closed.
Areas worthy of attention:
Supports: 0.79 handle; 0.7869; 0.7801; 0.7897-0.7870.
Resistances: 0.7948-0.7926; 0.7956; 0.8065; 0.7986-0.7951.
USD/JPY:
Weekly gain/loss: -1.79%
Weekly closing price: 110.99
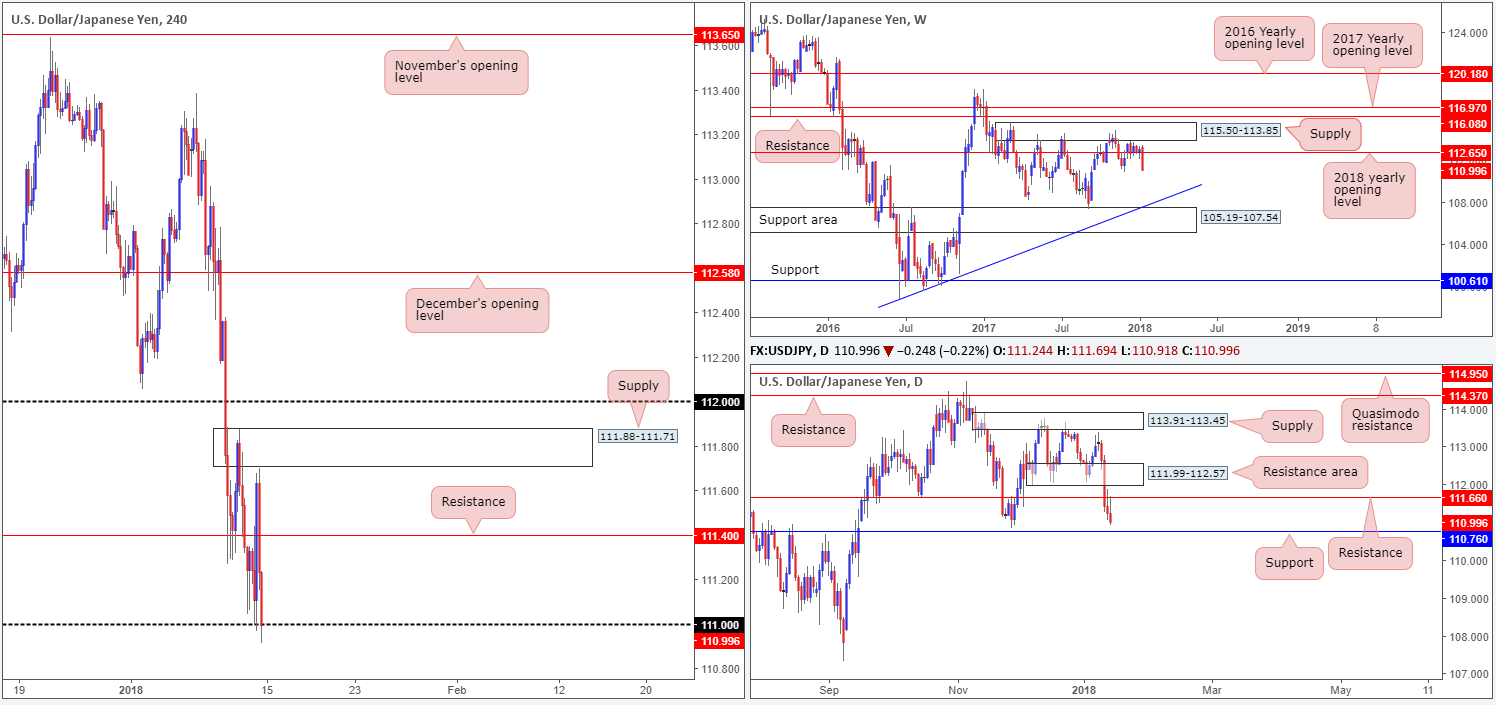
The strong near-full-bodied weekly bearish candle produced last week aggressively wiped out bids residing around the 2018 yearly opening level seen on the weekly timeframe at 112.65. Continued selling in this fashion may eventually see the weekly candles cross swords with a weekly support area at 105.19-107.54 and a converging weekly trendline taken from the low 98.78.
Turning our attention to the daily timeframe, the recent break of support at 111.66 on Wednesday was shortly after respected as a resistance during both Thursday and Friday’s sessions. Last week’s four-day selling frenzy was a consequence of an overall weaker dollar and the BoJ’s announcement of bond-buying reduction. While the retest of 111.66 further confirms bearish strength, let’s be mindful of the fact that there is also a nearby daily support band marked at 110.76.
A brief look at recent dealings on the H4 timeframe reveals that the 111 handle remains in play, despite an earnest attempt on the sell side to breach this number in the later hours of Friday’s US segment. If 111 is consumed today/this week, then the H4 mid-level support at 110.50 will likely be the next port of call on the this scale. That is, assuming the daily bears can penetrate daily support at 110.76 first!
Market direction:
A decisive break of both the 111 handle and daily support at 110.76 would be required before any kind of bearish play could be executed. Even with that, though, one would still need to contend with 110.50 on the H4 timeframe as a possible level of support.
At this time, we do not see any setups hosting clear confluence. So, choosing to stand on the sidelines here may be the better path to take today.
Data points to consider: No high-impacting news events on the docket; US banks closed.
Areas worthy of attention:
Supports: 111 handle; 110.50; 110.76; 105.19-107.54.
Resistances: 112.65; 111.66; 111.40.
USD/CAD:
Weekly gain/loss: +0.41%
Weekly closing price: 1.2455
During the course of last week’s session, weekly movement beautifully retested the underside of the 2018 yearly opening level seen on the weekly timeframe at 1.2579. With the level holding firm, the week ended printing a strong-looking selling wick. Whether this selling is sustainable over the coming weeks is difficult to judge, but one thing we are relatively sure on is that weekly price shows little support on the horizon until we reach weekly demand seen at 1.1919-1.2074.
The daily supply area at 1.2554-1.2510 suffered back-to-back upside breaches on Wednesday and Thursday last week. While this likely cleared a truckload of stop orders above the zone, this also potentially provided big players the liquidity required to sell! Remember, when a seller’s stop-loss order is triggered, it automatically becomes a buy. A buy is what is required to sell! This – coupled with the daily bearish selling wick chalked up on Thursday and overall dollar weakness – allowed for a dominant selloff, placing the unit within striking distance of 1.2390: a 61.8% daily Fib support.
In Wednesday’s report, we underlined a significant resistance zone between the 1.26 handle seen on the H4 timeframe and a H4 resistance band placed at 1.2580 (green rectangle). The reasoning behind selecting this area was due to resistance coming in from the 2018 yearly opening level, and the daily supply. After seeing strong selling interest materialize from 1.26/1.2580 on Thursday, we went on to report (in Friday’s outlook) that a close beneath the 1.25 handle was a real possibility, with the prospect of 1.24ish in the near future. Well done to any of our readers who managed to take advantage of 1.26/1.2580.
Market direction:
In spite of the market closing a few pips ahead of the H4 mid-level number 1.2450, further downside is still likely. The 1.24 handle is a logical target, in our view, since it aligns beautifully with the daily Fib number on the daily chart, which is the next downside target on that scale.
Data points to consider: No high-impacting news events on the docket; US banks closed.
Areas worthy of attention:
Supports: 1.24 handle; 1.2450; 1.2390; 1.1919-1.2074.
Resistances: 1.25 handle; 1.2579; 1.2554-1.2510.
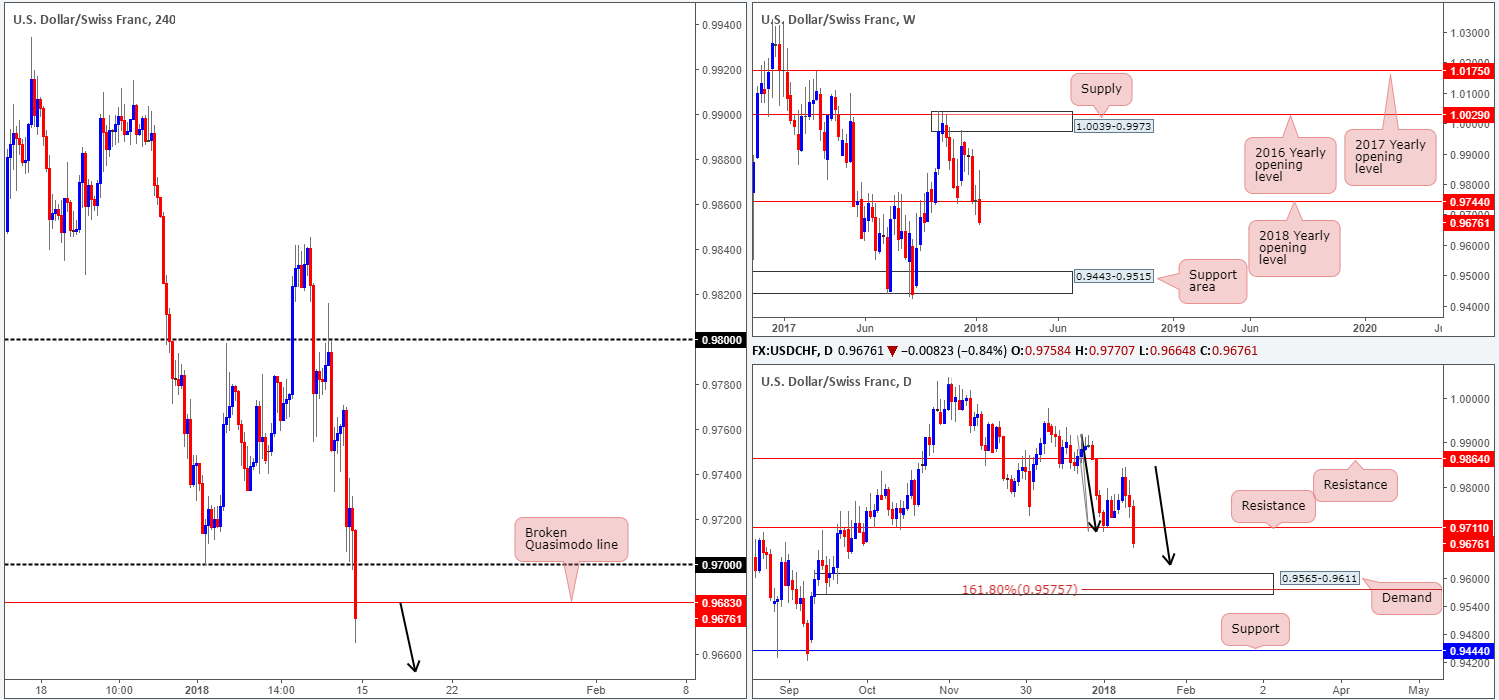
USD/CHF:
Weekly gain/loss: -0.80%
Weekly closing price: 0.9676
Despite a brief pause around the 2018 yearly opening level at 0.9744 two weeks ago, in the shape of a weekly indecision candle, the pair was incapable of mustering enough strength to defend the line last week and therefore descended lower. Provided that the bears remain in the driving seat, a gradual approach towards a weekly support area located around the 0.9443-0.9515 neighborhood is possible.
Last week’s decline ended with daily price chewing through a daily support drawn from 0.9711 (now acting resistance). What this move also accomplished was forming a potential D-leg to a daily AB=CD bullish formation (see black arrows). The next area of interest beneath 0.9711, in our opinion, is the daily demand base at 0.9565-0.9611, which houses the 161.8% daily AB=CD Fib ext. point at 0.9575.
Friday’s action on the H4 timeframe reveals that the 0.97 handle was challenged going into the initial hours of US trading. While a short burst of buying was seen from the line, the psychological band eventually failed. The move below this number also took out a H4 Quasimodo support at 0.9683, and reached a session low of 0.9664.
Market direction:
The H4 broken Quasimodo line at 0.9683 is interesting. Looking down as low as the M15 timeframe, one is able to see that this level remains untested as a resistance. Given that broken Quasimodo lines boast a high success rate, as well as both the weekly and daily structures indicating that further downside may be on the horizon, selling around 0.9683 could be an option today, targeting the 0.96 handle (essentially the top edge of the aforementioned daily demand).
Data points to consider: No high-impacting news events on the docket; US banks closed.
Areas worthy of attention:
Supports: 0.9443-0.9515; 0.9565-0.9611; 0.9575; 0.96 handle.
Resistances: 0.97 handle; 0.9683; 0.9744; 0.9711.
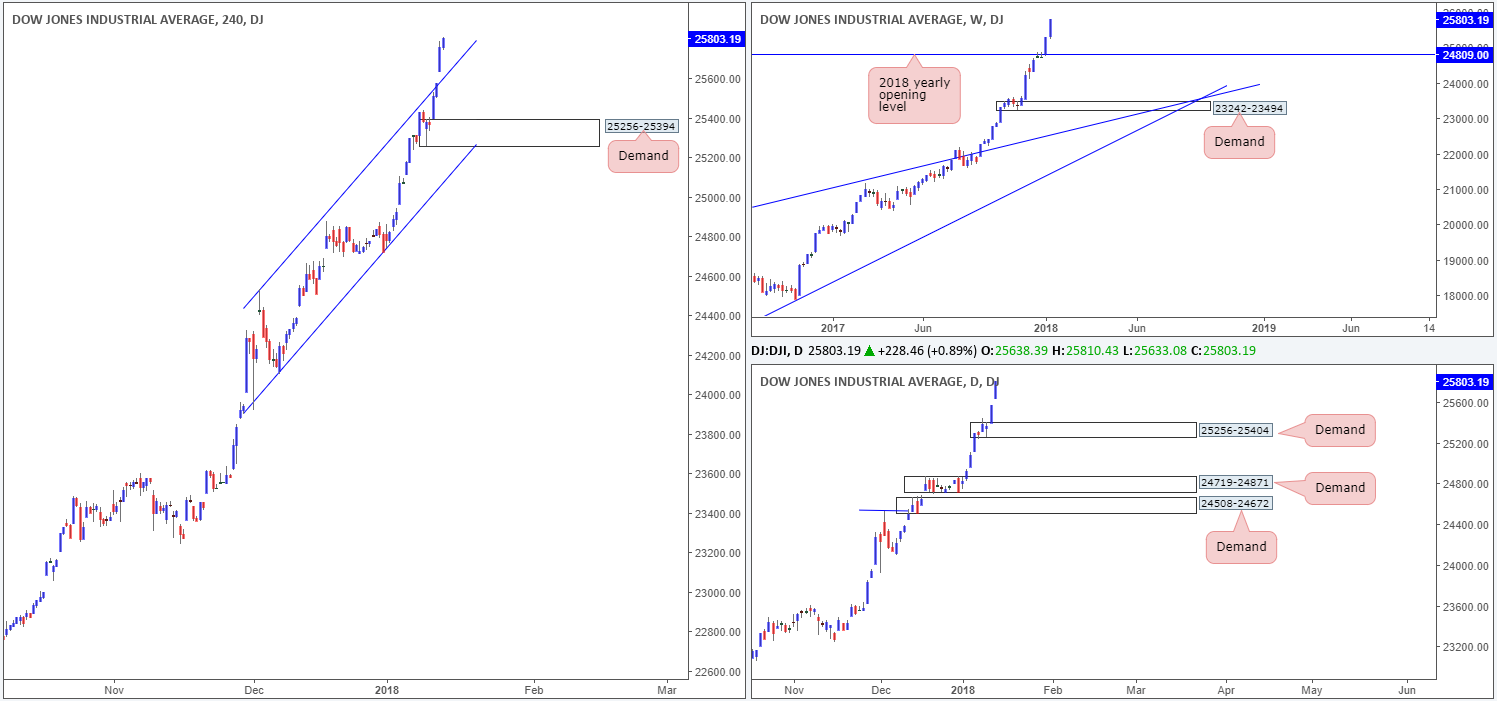
DOW 30:
Weekly gain/loss: +2.01%
Weekly closing price: 25803
In the shape of a full-bodied weekly bull candle US equities continued to extend higher last week, registering a record high of 25810. Should the index pullback on the weekly timeframe this week, the next base of support can be seen around the 2018 yearly opening level at 24809.
Last week’s advance also formed a nice-looking daily demand base coming in at 25256-25404. This area boasts strong momentum from the base and will, in the event of a retracement, likely see a reaction.
Over on the H4 timeframe, the H4 channel resistance extended from the high 24534 was taken out. This was the last remaining obstacle stopping the unit from reaching record highs. Now that this resistance has been cleared, the engulfed line could potentially be used as platform for buyers today/this week.
Market direction:
As far as we see things, there are a few levels in the offing right now:
- Look to trade any retest seen off of the recently broken H4 channel resistance-turned support.
- Failing that, look for price to dip lower and test the H4 demand at 25256-25394. As this area is housed within the lower limits of the aforementioned daily demand, the odds of price responding from this zone are high, in our view.
Data points to consider: No high-impacting news events on the docket; US banks closed.
Areas worthy of attention:
Supports: H4 channel support; 25256-25394; 24809; 25256-25404.
Resistances: …
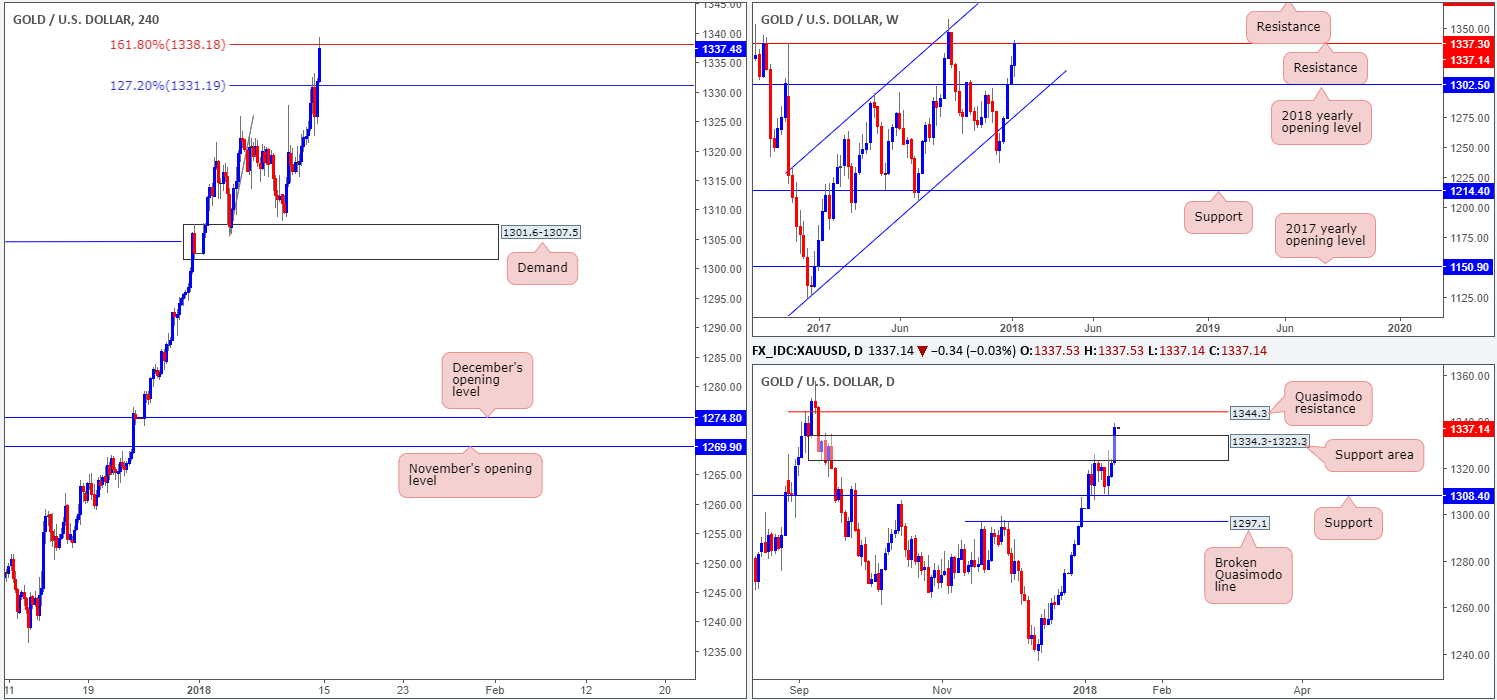
GOLD:
Weekly gain/loss: +1.39%
Weekly closing price: 1337.1
In a similar fashion to the AUD/USD, the gold market chalked in its fifth consecutive weekly gain last week. Unlike the Aussie dollar, however, the yellow metal shook hands with a weekly resistance level plotted at 1337.3! A continuation of buying this week would likely see this resistance consumed and the metal begin approaching a weekly resistance plotted at 1375.5.
For the best part of the month so far, the daily candles were confined between a daily resistance area at 1334.3-1323.3 and a daily support level pegged at 1308.4. It wasn’t until Friday last week did we see the bulls go on the offensive and take out the said resistance area in strong fashion. This has, as you can see, opened up the path north to a daily Quasimodo resistance level at 1344.3.
The H4 127.2% Fib ext. point at 1331.1 did a superb job in holding back the buyers amid the early hours of Friday’s US session, correcting as far south as the 1322.5 region. Try as it might, though, the unit was unable to muster enough strength to contain the buyers and price rallied to a high of 1339.3, ultimately crossing swords with the H4 161.8% Fib ext. point at 1338.1.
Market direction:
The weekly resistance level mentioned above at 1337.3 should be a concern for buyers, as should the daily Quasimodo resistance level at 1344.3. Given the history the weekly resistance level retains and how well defined the daily Quasimodo is, we would exercise caution if attempting to long this market on a medium/long-term basis.
So, with that in mind what about some downside? Active sellers coming in from the aforesaid daily Quasimodo is certainly a possibility. However, they would need to be willing to cut the trade short should daily bulls look to defend the nearby daily support area at 1334.3-1323.3!
Areas worthy of attention:
Supports: 1334.3-1323.3.
Resistances: 1338.1; 1337.3; 1375.5; 1344.3.
This site has been designed for informational and educational purposes only and does not constitute an offer to sell nor a solicitation of an offer to buy any products which may be referenced upon the site. The services and information provided through this site are for personal, non-commercial, educational use and display. IC Markets does not provide personal trading advice through this site and does not represent that the products or services discussed are suitable for any trader. Traders are advised not to rely on any information contained in the site in the process of making a fully informed decision.
This site may include market analysis. All ideas, opinions, and/or forecasts, expressed or implied herein, information, charts or examples contained in the lessons, are for informational and educational purposes only and should not be construed as a recommendation to invest, trade, and/or speculate in the markets. Any trades, and/or speculations made in light of the ideas, opinions, and/or forecasts, expressed or implied herein, are committed at your own risk, financial or otherwise.
The use of the site is agreement that the site is for informational and educational purposes only and does not constitute advice in any form in the furtherance of any trade or trading decisions.
The accuracy, completeness and timeliness of the information contained on this site cannot be guaranteed. IC Markets does not warranty, guarantee or make any representations, or assume any liability with regard to financial results based on the use of the information in the site.
News, views, opinions, recommendations and other information obtained from sources outside of www.icmarkets.com.au, used in this site are believed to be reliable, but we cannot guarantee their accuracy or completeness. All such information is subject to change at any time without notice. IC Markets assumes no responsibility for the content of any linked site. The fact that such links may exist does not indicate approval or endorsement of any material contained on any linked site.
IC Markets is not liable for any harm caused by the transmission, through accessing the services or information on this site, of a computer virus, or other computer code or programming device that might be used to access, delete, damage, disable, disrupt or otherwise impede in any manner, the operation of the site or of any user’s software, hardware, data or property.


