A note on lower timeframe confirming price action…
Waiting for lower timeframe confirmation is our main tool to confirm strength within higher timeframe zones, and has really been the key to our trading success. It takes a little time to understand the subtle nuances, however, as each trade is never the same, but once you master the rhythm so to speak, you will be saved from countless unnecessary losing trades. The following is a list of what we look for:
- A break/retest of supply or demand dependent on which way you’re trading.
- A trendline break/retest.
- Buying/selling tails/wicks – essentially we look for a cluster of very obvious spikes off of lower timeframe support and resistance levels within the higher timeframe zone.
- Candlestick patterns. We tend to stick with pin bars and engulfing bars as these have proven to be the most effective.
We search for lower timeframe confirmation between the M15 and H1 timeframes, since most of our higher-timeframe areas begin with the H4. Stops are usually placed 3-5 pips beyond confirming structures.
EUR/USD:
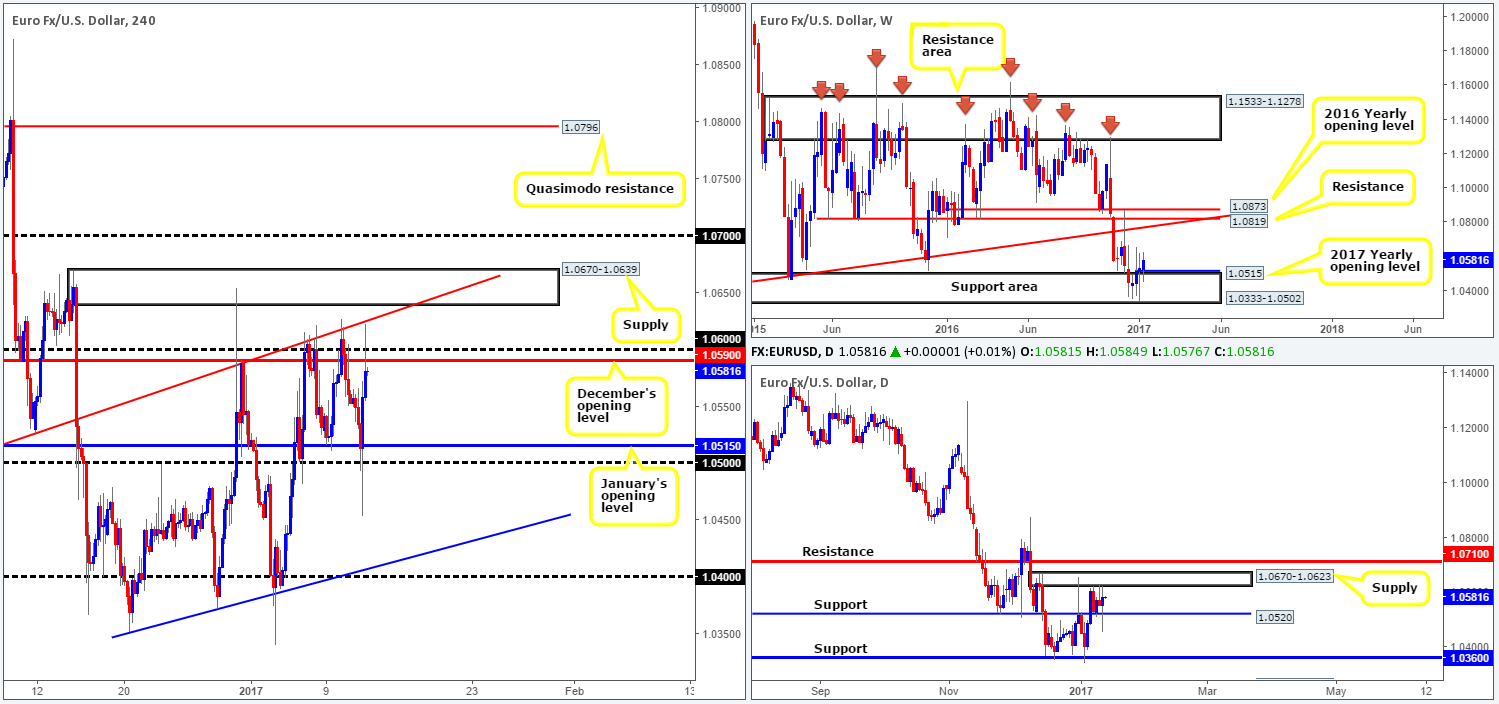
The value of the dollar weakened in aggressive fashion yesterday following Donald Trump’s press conference. Trump said very little to bolster the currency which inevitably led to its selloff. The EUR/USD, as a result, took off north. This saw the major, once again, whipsaw through offers around both December’s opening level at 1.0590 and neighboring psychological level 1.06, which just missed connecting with the H4 trendline resistance stretched from the low 1.0504.
Looking at the bigger picture, we can see that daily action has been sandwiched between daily supply at 1.0670-1.0623 and daily support drawn from 1.0520 since Friday. Over on the weekly chart, nevertheless, the single currency is currently seen inching higher from a weekly support area coming in at 1.0333-1.0502. Of particular interest here is that there’s little seen standing in the way of further upside in this market until the long-term weekly trendline resistance extended from the low 0.8231.
Our suggestions: One could look at selling from the 1.06 region today (December’s opening level/round number – see above) given the daily supply area in play at the moment. However, there are two cautionary points to consider. Firstly, there is a high probability that this unit will eventually fake beyond 1.06 and test the nearby H4 supply area soon. Secondly, selling the EUR places one against the might of (possible) weekly bids (see above). For that reason, if you plan on selling this market, at least consider waiting for some form of H4 candle confirmation or, if you prefer, a lower-timeframe confirming setup (see the top of this report for details).
Data points to consider: ECB Monetary policy meeting at 12.30pm. US Jobless claims at 1.30pm GMT along with Fed members Evans and Harker taking the stage.
Levels to watch/live orders:
- Buys: Flat (stop loss: N/A).
- Sells: 1.06 region ([confirmation is required here before our team will consider pulling the trigger] stop loss: depends on where one confirms the zone).
GBP/USD:
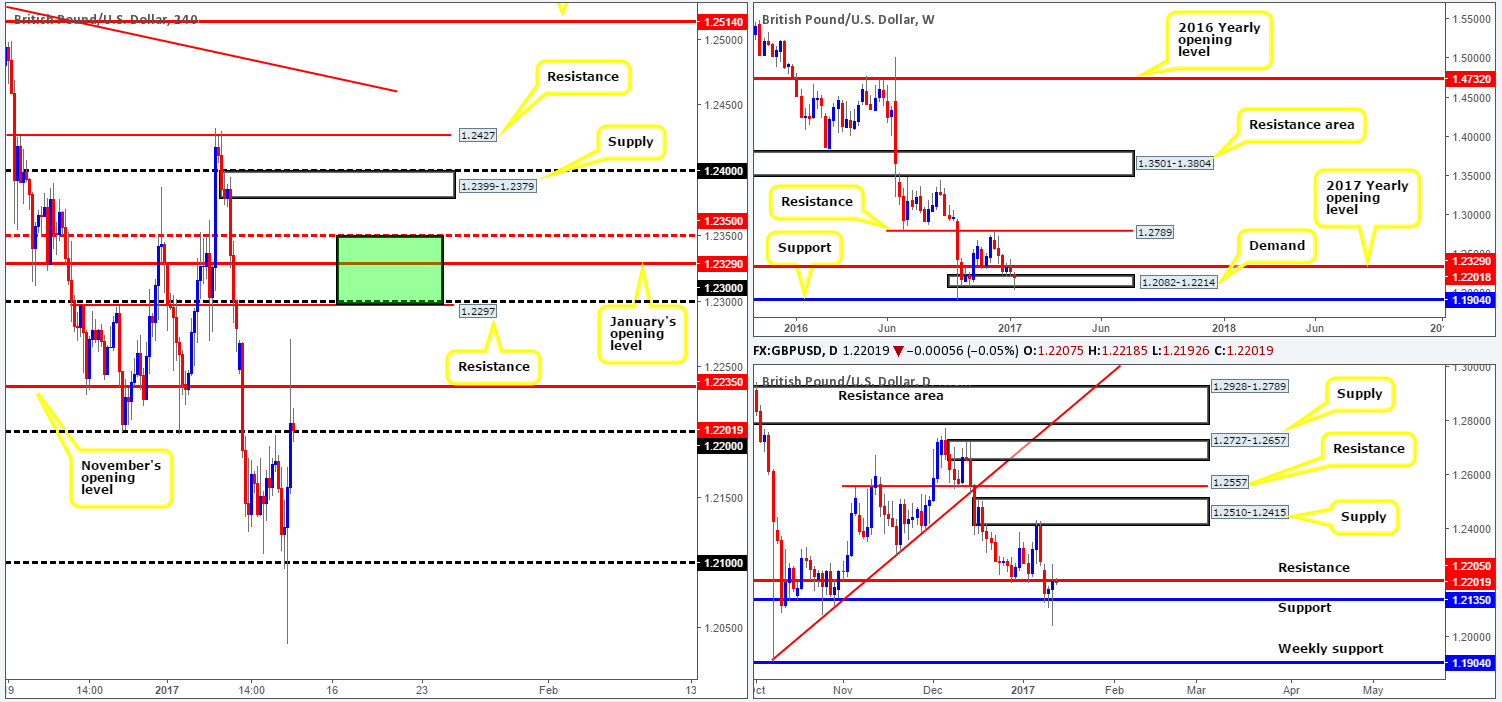
Sterling, as you can see, caught a fresh bid going into Trump’s presser yesterday. After violently whipsawing through the 1.21 psychological handle (reaching a low of 1.2037), the pair gravitated to highs of 1.2271 on the day. As we write, the 1.22 handle is currently in play. This likely has something to do with the fact that it’s bolstered nicely by daily resistance chiseled in at 1.2205.
Before traders look to press the sell button here, however, you may want to note that weekly action is trading from weekly demand marked at 1.2082-1.2214. Assuming that this area holds ground, a retest of the 2017 yearly opening level at 1.2390 could be on the cards. On these grounds, we could see the pair stretch north to test our H4 (green) sell zone comprised of: the H4 mid-way resistance 1.2350, January’s opening level at 1.2390, H4 resistance at 1.2297 and the 1.23 handle, in the near future.
Our suggestions: In a similar fashion to the EUR/USD pair, one could look to sell 1.22 today, but know that you’re potentially selling into weekly buyers (see above). We would strongly recommend only shorting this psychological number if, and only if, you’re able to pin down some form of H4 candle confirmation or even, if you prefer, a lower-timeframe confirming setup (see the top of this report for details).
Data points to consider: US Jobless claims at 1.30pm GMT along with Fed members Evans and Harker taking the stage.
Levels to watch/live orders:
- Buys: Flat (stop loss: N/A).
- Sells: 1.22 region ([confirmation is required here before our team will consider pulling the trigger] stop loss: depends on where one confirms the zone).
AUD/USD:
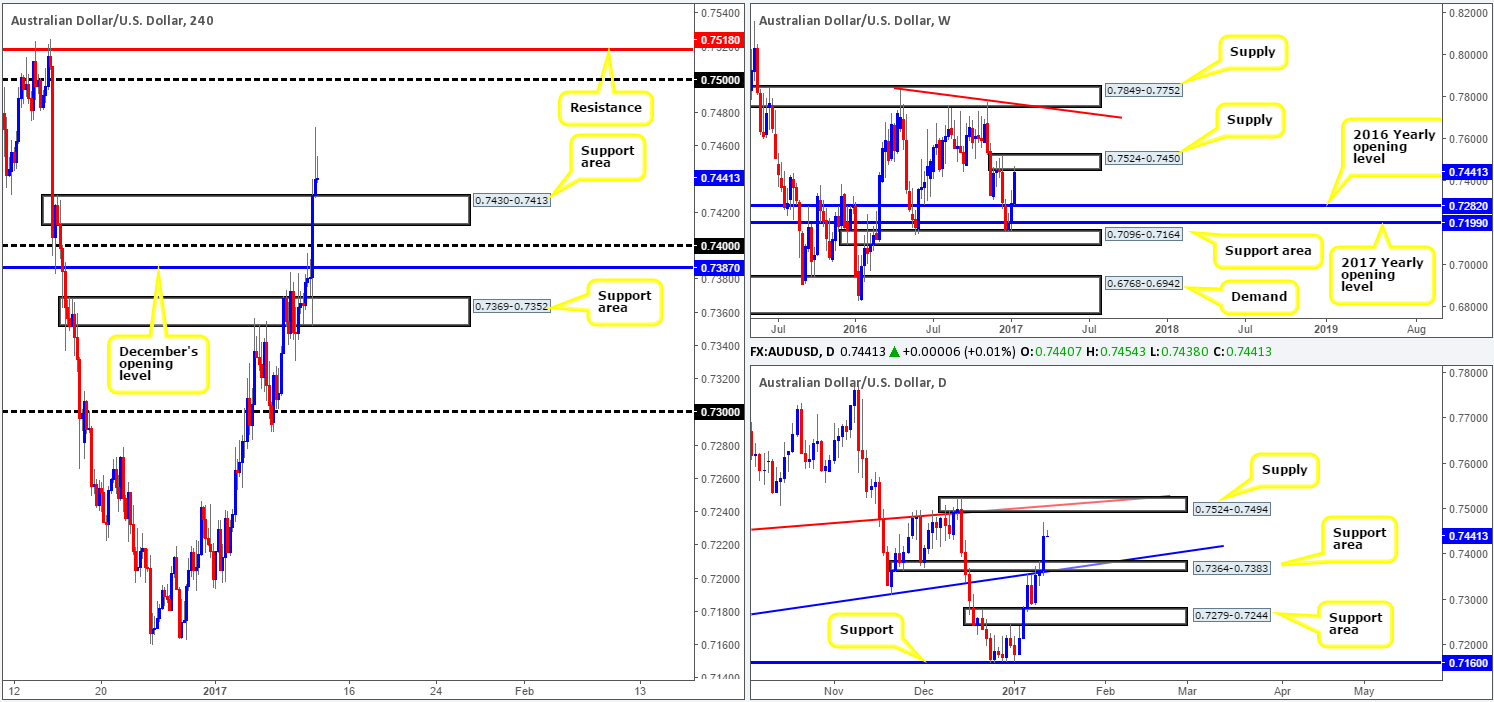
Buoyed by advancing gold prices and a waning US dollar (thanks largely to Trump’s recent presser), the commodity currency rocketed north yesterday. Several H4 tech resistances were engulfed amid the rally, with price seen topping at highs of 0.7471 on the day. The next upside objective on the H4 chart, at least in our opinion, is positioned around the 0.75 handle.
In conjunction with H4 structure, the daily chart also shows similar structure. The daily resistance area at 0.7364-0.7383 (now a support zone) was recently taken out and, as far as we can see, appears to have cleared the pathway north up to daily supply coming in at 0.7524-0.7494. Not only does this daily supply fuse beautifully with a daily trendline resistance taken from the low 0.7407, it also houses the 0.75 handle mentioned above. On the other side of the fence, nonetheless, weekly price is already seen teasing the underside of a weekly supply area registered at 0.7524-0.7450.
Our suggestion: Looking for long opportunities on any retest of the H4 support area at 0.7430-0.7413, according to both the H4 and daily charts, is valid. While a long from this area is tempting, our desk has chosen to side step this potential setup solely due to where price is located on the weekly chart (see above). In case that some traders still believe buying on any retest of the above noted H4 support zone is feasible, waiting for at least some form of H4 candle confirmation/lower-timeframe buying setup (see the top of this report) is advised before pressing the buy button.
Data points to consider: US Jobless claims at 1.30pm GMT along with Fed members Evans and Harker taking the stage.
Levels to watch/live orders:
- Buys: 0.7430-0.7413 ([confirmation is required here before our team will consider pulling the trigger] stop loss: depends on where one confirms the zone).
- Sells: Flat (stop loss: N/A).
USD/JPY:
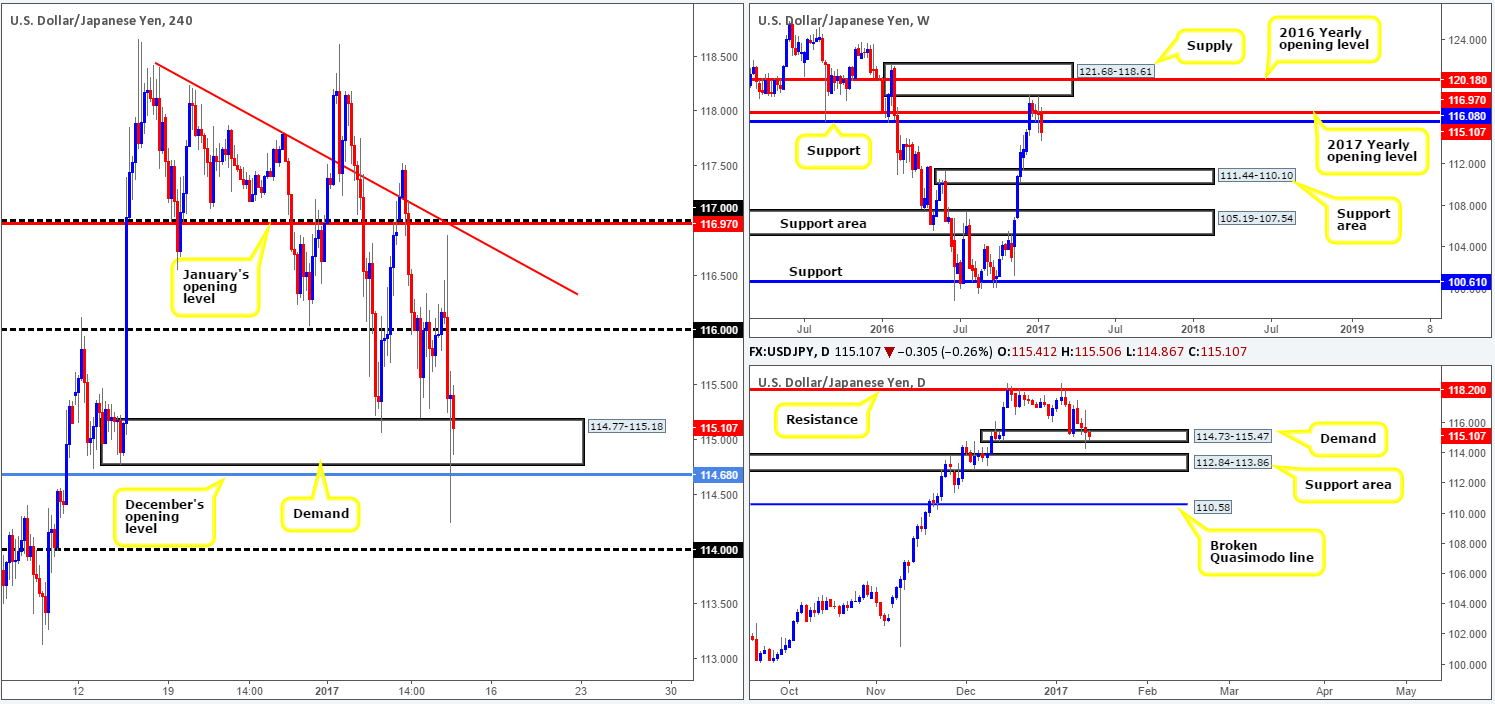
Fueled by Trump’s press conference yesterday, the USD/JPY sold off from highs of 116.87 and plunged to lows of 114.24 a few hours ahead of the close. H4 demand at 114.77-115.18 and December’s opening level at 114.86 both suffered a breach during the recent selloff. This begs the question, was this move enough to take out the sell stops below these areas? We believe it has severely weakened this region and has potentially opened up downside to the 114 handle.
A similar scenario exists on the daily chart, except the next downside target on this scale falls in at 112.84-113.86: a daily support area. In addition to this, in recent days we’ve seen the current weekly candle edge below weekly support at 116.08. A weekly close beyond this level could, in our view, set the stage for a fairly substantial move to the weekly support area coming in at 111.44-110.10.
Our suggestions: Ultimately, our desk is watching for a H4 close to form beyond the current H4 demand area. This – coupled with a retest and a lower-timeframe confirming sell setup (see the top of this report) would be sufficient enough to permit a short entry, targeting 114 as an initial take-profit target.
Data points to consider: US Jobless claims at 1.30pm GMT along with Fed members Evans and Harker taking the stage.
Levels to watch/live orders:
- Buys: Flat (stop loss: N/A).
- Sells: Watch for a H4 close beyond H4 demand at 114.77-115.18 and look to trade any retest of this zone thereafter (lower-timeframe confirmation is required following the retest] stop loss: depends on where one confirms the zone).
USD/CAD:
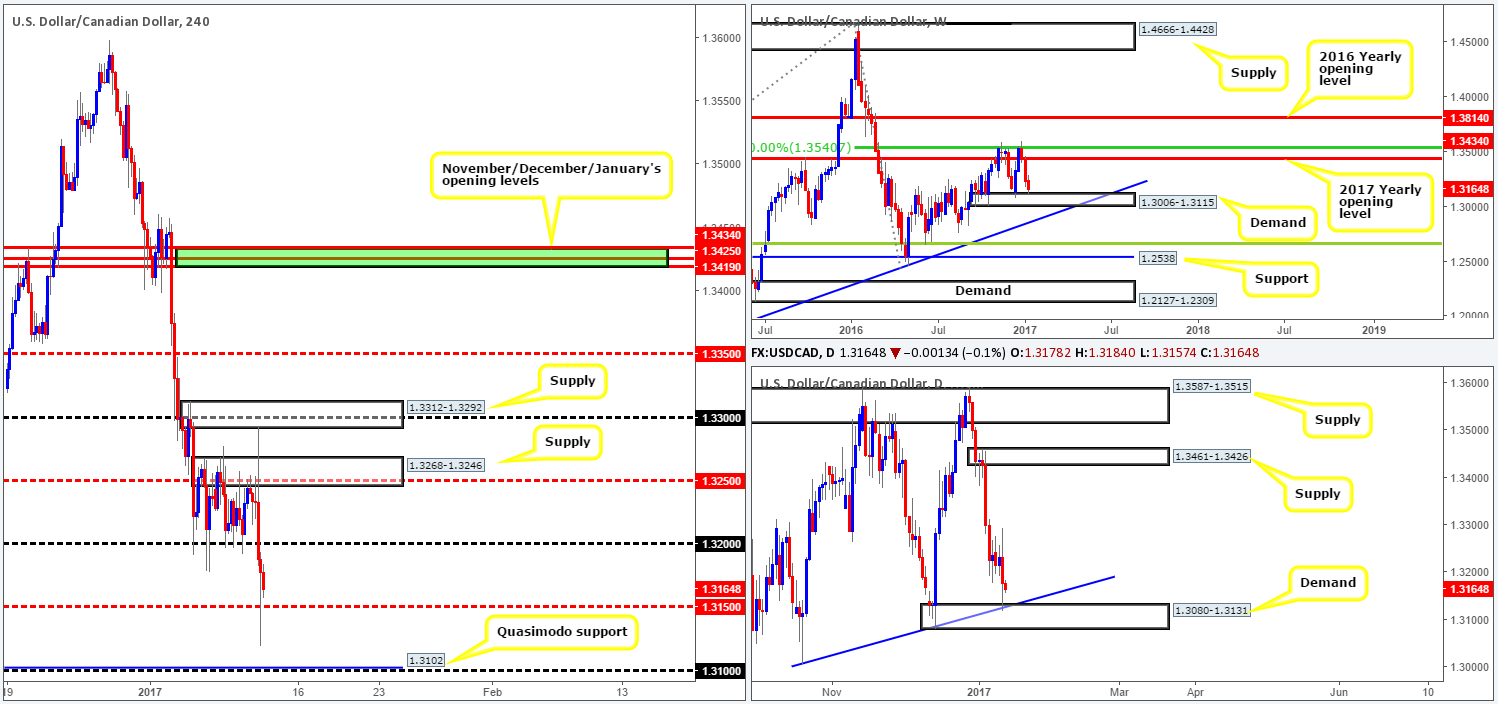
After aggressively whipsawing through H4 supply at 1.3268-1.3246 and clipping the underside of another H4 supply area fixed at 1.3312-1.3292, the pair sold off. Charged by Trump’s press conference yesterday, the 1.32 handle was wiped out followed by a rather substantial whipsaw seen through the H4 mid-way support level at 1.3150. Despite this recent movement, a quick look over at both the weekly and daily charts should, at least from a structural perspective, give off some bullish vibes. Weekly demand at 1.3006-1.3115 as well as its partner demand seen on the daily chart at 1.3080-1.3131 (fuses with a daily trendline support taken from the low 1.3006) are now in play.
Our suggestions: Having seen the market’s position on the bigger picture, we are confident higher prices are in store. This leaves us with the challenge of finding a suitable entry. In spite of 1.3150 being the more obvious level to look to buy from, we are more drawn to the Quasimodo support seen lower down on the curve at 1.3102. As such, our plan of action is simply to wait and see if price hits this level and shows any response. Should a reaction come into view, a trade long will be taken, targeting the nearest H4 supply formed on approach.
Data points to consider: US Jobless claims at 1.30pm GMT along with Fed members Evans and Harker taking the stage.
Levels to watch/live orders:
- Buys: 1.3102 ([watch for a bullish response from this number before pressing the buy button] stop loss: ideally beyond the trigger candle).
- Sells: Flat (stop loss: N/A).
USD/CHF:
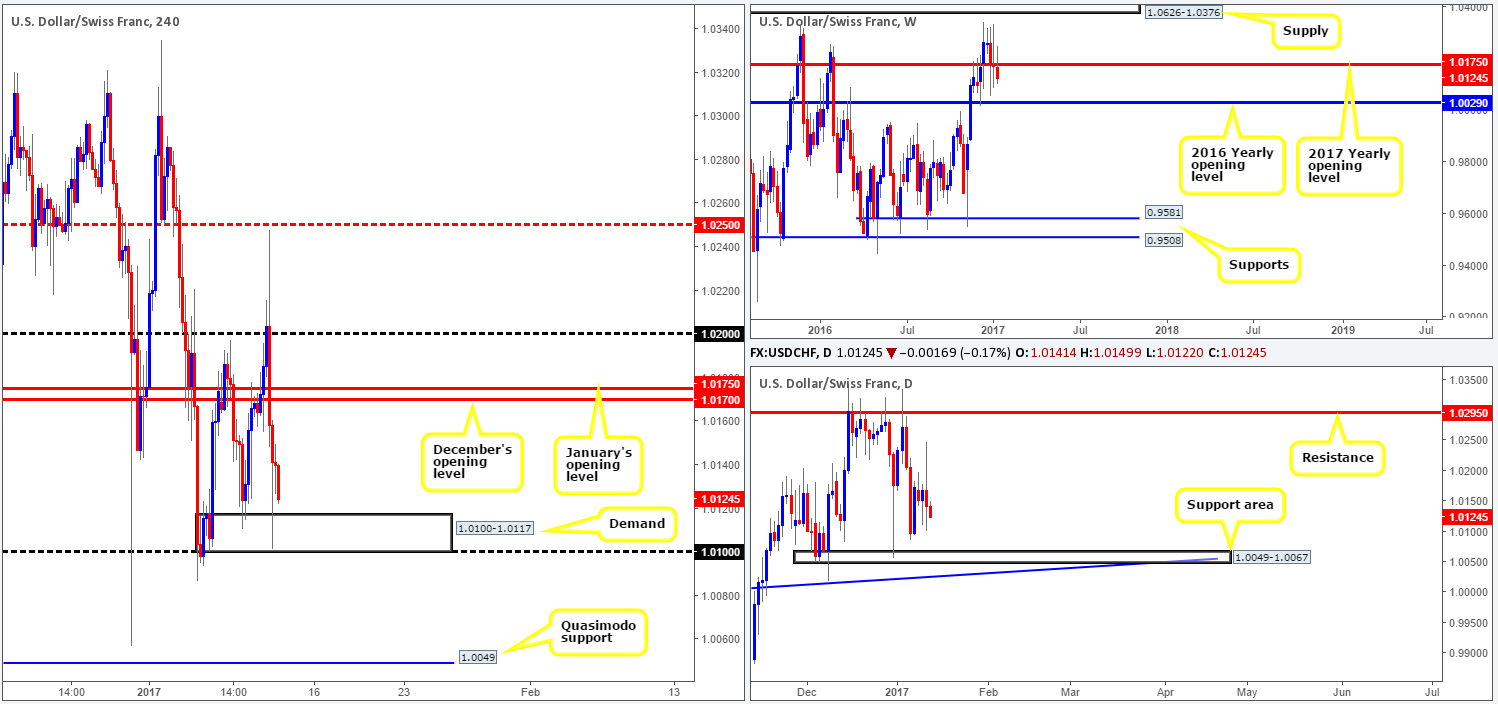
In recent sessions, we saw the USD/CHF aggressively tumble lower on the back of Donald Trump’s recent presser. This near 150-pip descent, as can be seen from the H4 chart, ended with price stabbing deep into a H4 demand drawn from 1.0100-1.0117. Although this area remains firm for the time being, we feel it is on the verge of giving way soon. Our reasoning simply comes from seeing the weekly chart continue to hold ground beneath the 2017 yearly opening level at 1.0175, and also there’s little seen standing in the way of a selloff on the daily chart down to the daily support area at 1.0049-1.0067.
Our suggestions: Through the simple lens of a technical trader, buying from the current H4 demand is not something our desk would feel comfortable taking part in. What is interesting, nevertheless, is the H4 Quasimodo support level at 1.0049. This level denotes the lower edge of the daily support area mentioned above at 1.0049-1.0067 and is also positioned nearby the 2016 yearly opening level at 1.0029. Therefore, 1.0029/1.0049 will likely be a critical juncture to look out for in the very near future.
Data points to consider: US Jobless claims at 1.30pm GMT along with Fed members Evans and Harker taking the stage.
Levels to watch/live orders:
- Buys: 1.0029/1.0049 (keep an eye on this area for long opportunities. Dependent on the time of day one may consider this area stable enough to permit entry without confirmation). Stop loss: 1.0025.
- Sells: Flat (stop loss: N/A).
DOW 30:
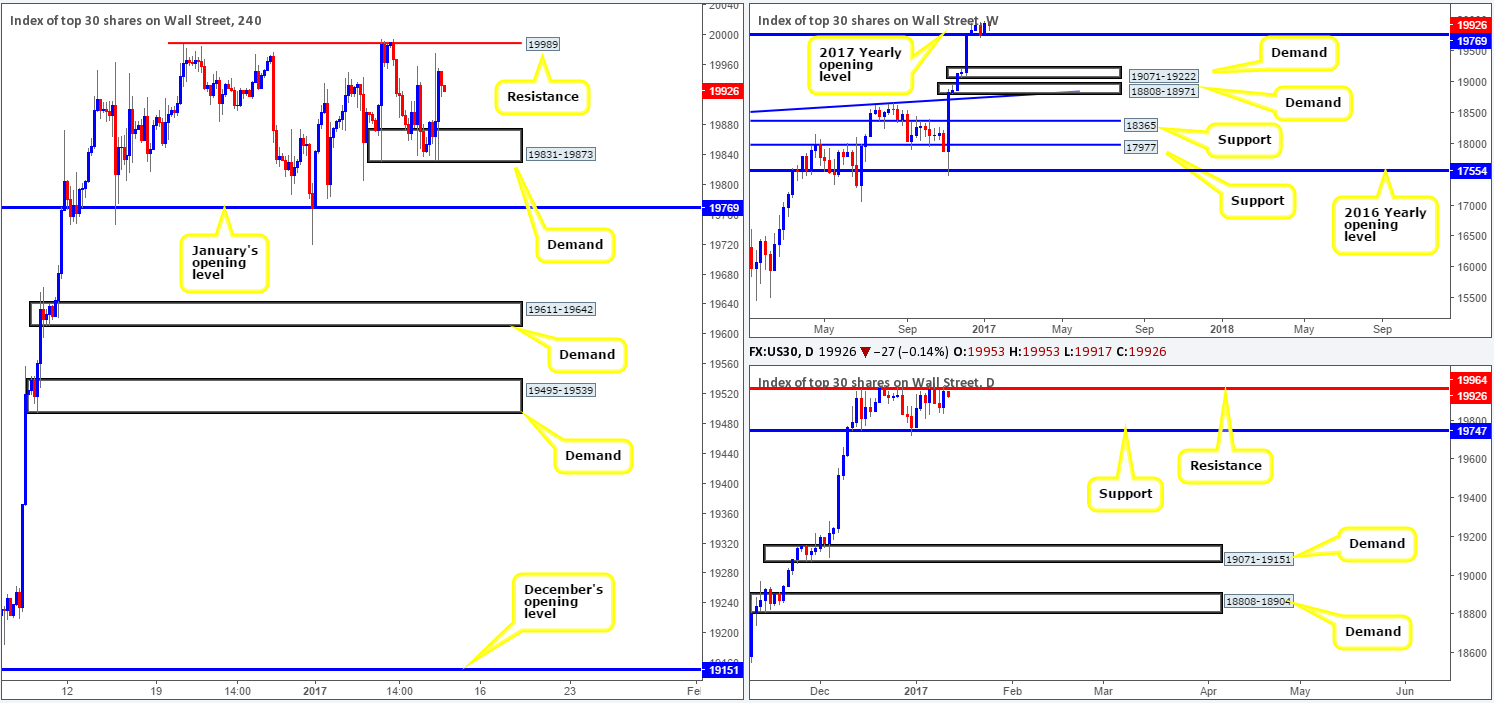
Donald Trump’s press conference yesterday initially sparked a selloff in the US equity market, forcing price to test the extremes of a H4 demand area at 19831-19873. While this zone remains intact, daily price is, at this time, seen selling off from daily resistance at 19964. To our way of seeing things, this could very well end with H4 action engulfing the current H4 demand base with price potentially going on to test January’s opening level at 19769. January’s opening level – coupled with the daily support at 19747 (denotes the lower edge of the daily range in play at the moment) is, in our view, an area worthy of attention and could be somewhere traders may want to consider buying from should price touch base with this zone.
Our suggestions: Since 19747/19769 is a relatively small area of support, we would not advise placing pending orders around this zone. The reason is simply due to the strong possibility of a fakeout! Waiting for either a H4 bull candle to form or a lower-timeframe confirming setup (see the top of this report) is, for us at least, the safer approach here we believe.
Data points to consider: US Jobless claims at 1.30pm GMT along with Fed members Evans and Harker taking the stage.
Levels to watch/live orders:
- Buys: 19747/19769 ([lower-timeframe confirmation required prior to pulling the trigger here in order to avoid the possibility of a fakeout given how small the buy zone is – see the top of the report for ideas on how to use this] stop loss: dependent on where one confirms the area).
- Sells: Flat (stop loss: N/A).
GOLD:
(Trade update: Stopped at breakeven for a small win – for details, please see Wednesday’s report: http://www.icmarkets.com/blog/wednesday-11th-january-daily-technical-outlook-and-review/)
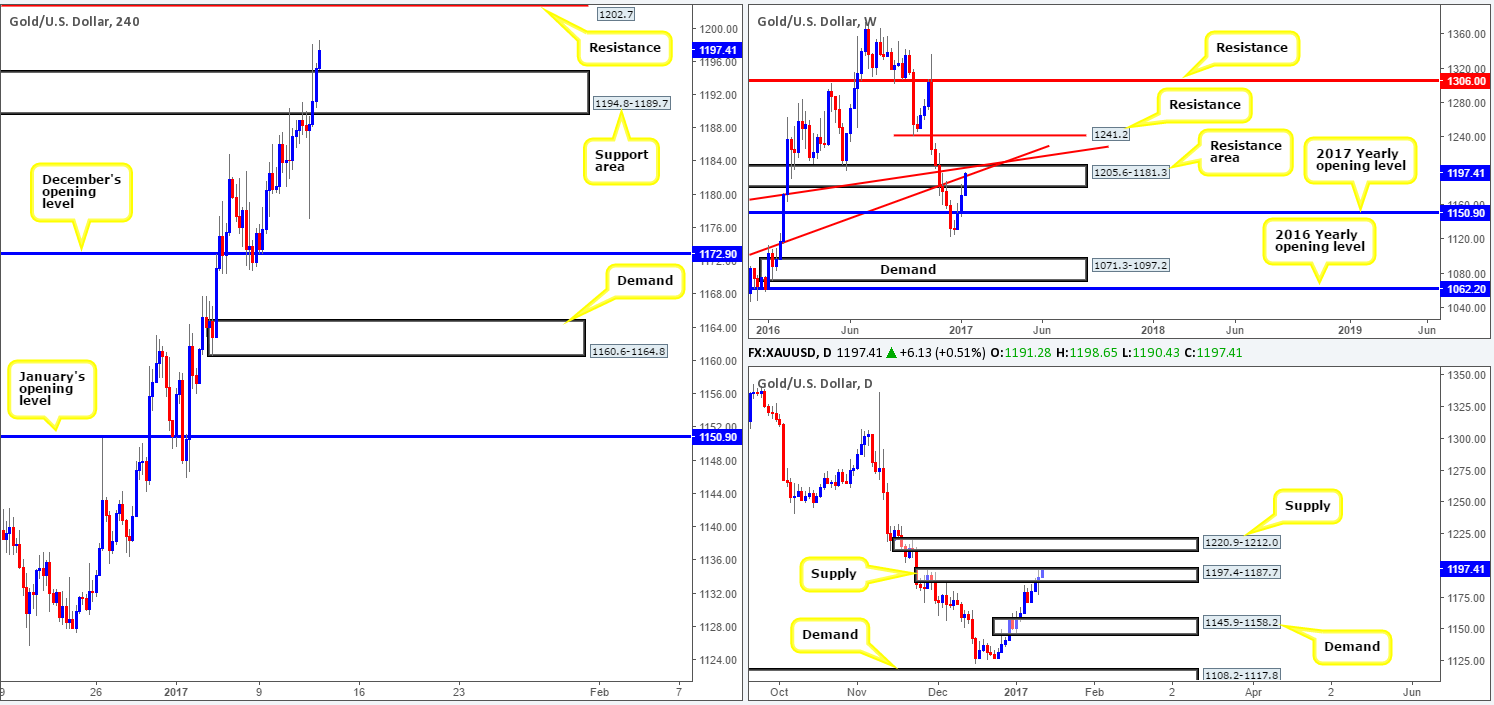
Across the board we saw the dollar tank (thanks to Donald Trump’s recent press conference); which as most are aware typically bolsters commodities. The yellow metal punched through offers at H4 supply drawn from 1194.8-1189.7 (now acting support area) yesterday, very likely opening up the path north for prices to challenge H4 resistance seen at 1202.7. While the daily chart also shows daily supply at 1197.4-1187.7 fading, traders should remain cognizant of weekly price currently trading within a weekly resistance area at 1205.6-1181.3 that’s reinforced by two weekly trendline resistances (1130.1/1071.2).
As we can see, current structure is forming conflicting opinions at present. A long above the current H4 support area places one in direct conflict with the weekly resistance area. Conversely, a short from within this weekly zone would be difficult to justify given the nearby H4 support area, and waning daily supply!
Our suggestions: There is, at least as far as our analysis goes, little to hang our hat on today. As such, we’ll remain on the sidelines and wait for further developments.
Levels to watch/live orders:
- Buys: Flat (stop loss: N/A).
- Sells: Flat (stop loss: N/A).


