EUR/USD:
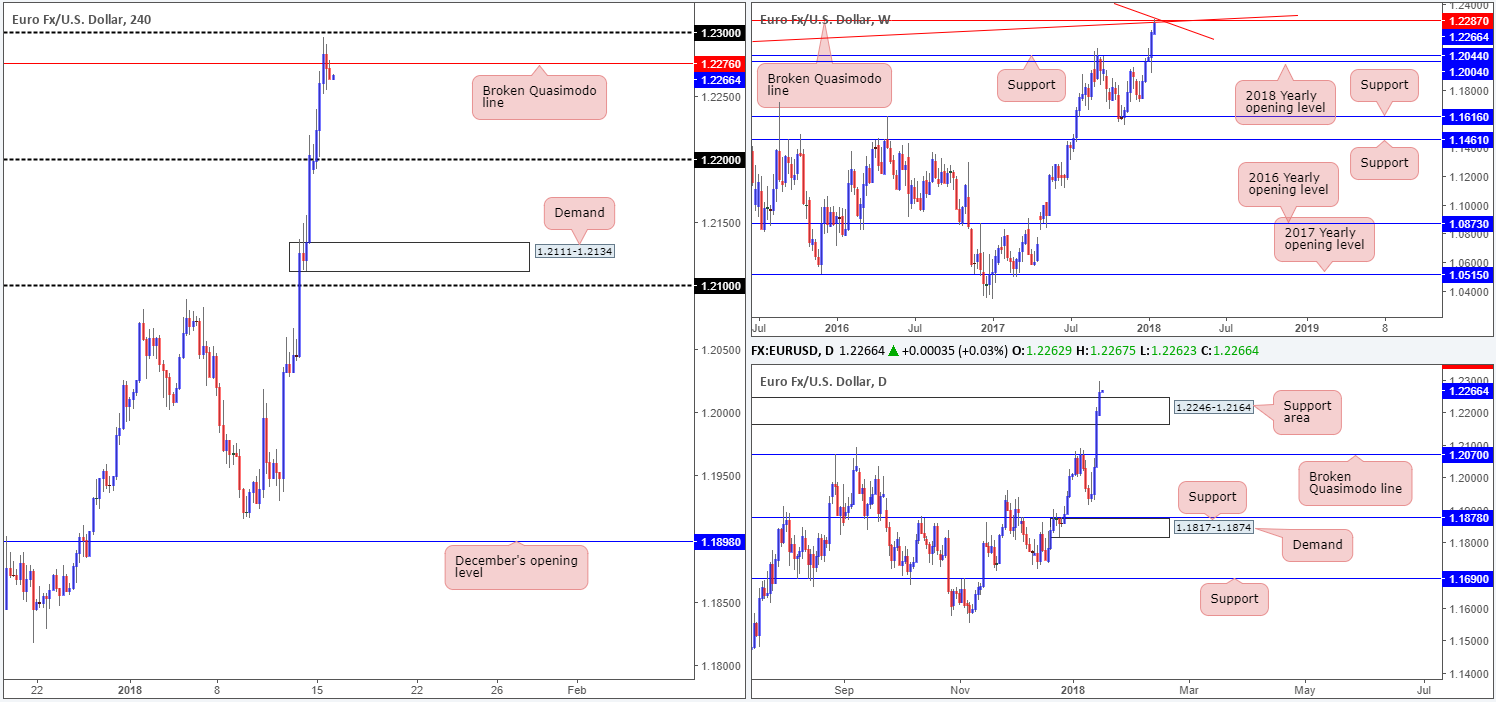
During the course of Monday’s trading segment, the single currency managed to extend last week’s gains, reaching a fresh high of 1.2296. As is evident from the H4 timeframe, however, the unit mildly pared upside a few pips ahead of the 1.23 handle as we entered into the US session. With US banks closed in observance of Martin Luther King Day, a clear sideways movement between 1.2296/1.2254 was seen into the closing bell.
Yesterday’s move also pulled weekly price up to a weekly broken Quasimodo line at 1.2287, which happens to converge with two weekly trendline resistances (1.1641/1.6038). Down on the daily timeframe, supply at 1.2246-1.2164 was consumed (now potential support area). A violation of this area has potentially opened up the path north to a daily broken Quasimodo line at 1.2359 (not seen on the screen).
Market direction:
Seeing as how H4 price managed to close back below a H4 broken Quasimodo line at 1.2276, and weekly price is seen linking arms with three major resistances, lower prices may be on the cards today/this week. The only grumble we have is the current daily support area!
For those shorts already in play, the 1.22 handle may be a viable first take-profit target. Beyond this number, we’d be eyeing the H4 demand/1.21 handle.
Data points to consider: US Empire state manufacturing index at 1.30pm GMT.
Areas worthy of attention:
Supports: 1.22 handle; 1.2111-1.2134; 1.21 handle; 1.2246-1.2164.
Resistances: 1.2287; weekly trendline resistances; 1.2359; 1.23 handle; 1.2276.
GBP/USD:
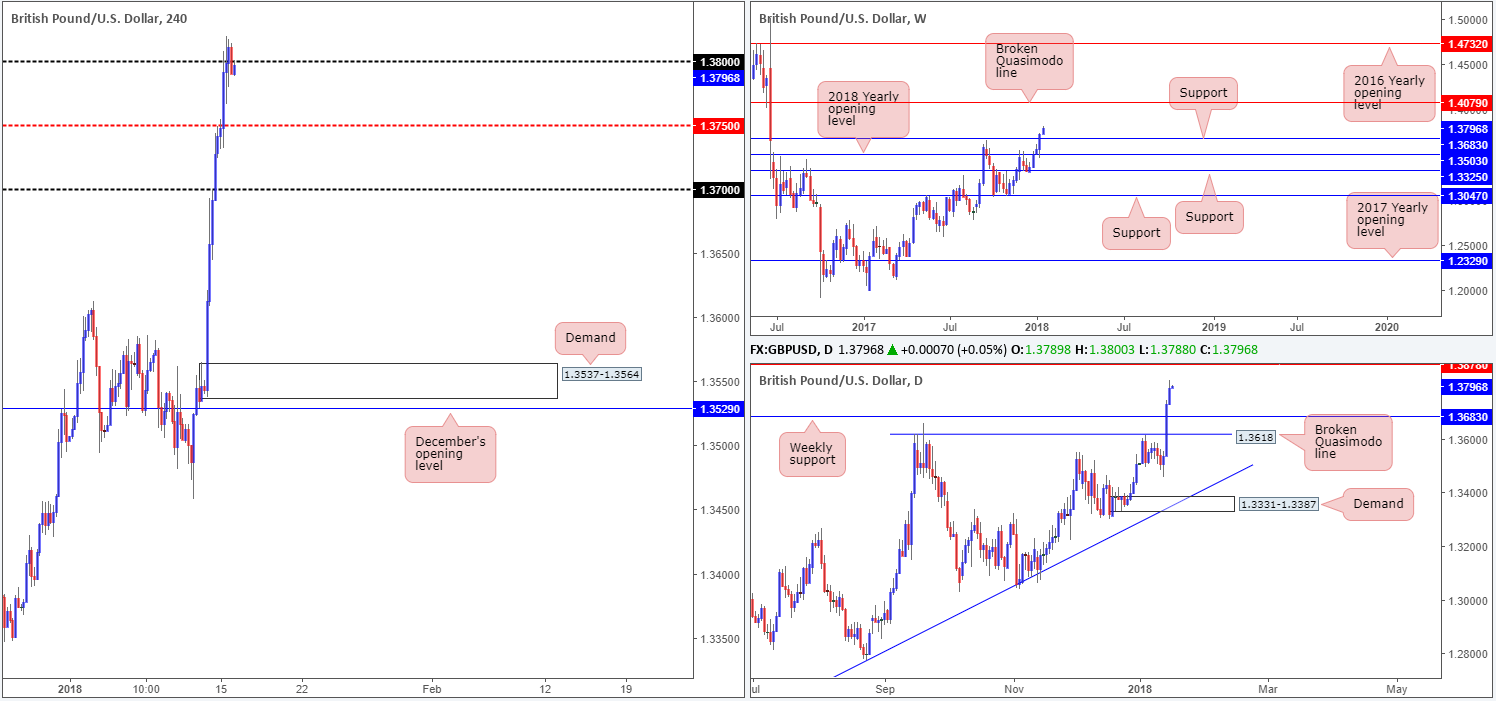
Driven by dollar softness, the British pound was seen pressing higher on Monday. Upon reaching the 1.38 neighborhood, nevertheless, demand waned somewhat as trading action calmed due to US banks being closed in observance of Martin Luther King Day.
While the H4 candles managed to end the day closing beneath 1.38, higher-timeframe structure indicates further upside could be a possibility. Weekly price managed to overcome a major weekly resistance level at 1.3683 (now acting support) during last week’s trading. In consequence to this, the runway north appears relatively free for the bulls to stretch their legs and approach the 1.40s, specifically a weekly broken Quasimodo line at 1.4079. On the daily timeframe, the break of the aforementioned weekly resistance placed a daily Quasimodo line in the firing range at 1.3878 (not seen on the screen).
Market direction:
Technically speaking, it is possible that 1.38 may be taken out today. For that reason, a decisive H4 close above this number, followed up with a strong retest could be a sign buyers are making another play to push higher.
Nevertheless, while the unit’s upside has been driven by a waning dollar, we have to take into consideration that UK inflation data is scheduled for release later on, which could shift focus away from the US dollar.
Data points to consider: UK inflation numbers at 9.30am; US Empire state manufacturing index at 1.30pm GMT.
Areas worthy of attention:
Supports: 1.37 handle; 1.3750; 1.3683.
Resistances: 1.38 handle; 1.4079; 1.3878.
AUD/USD:
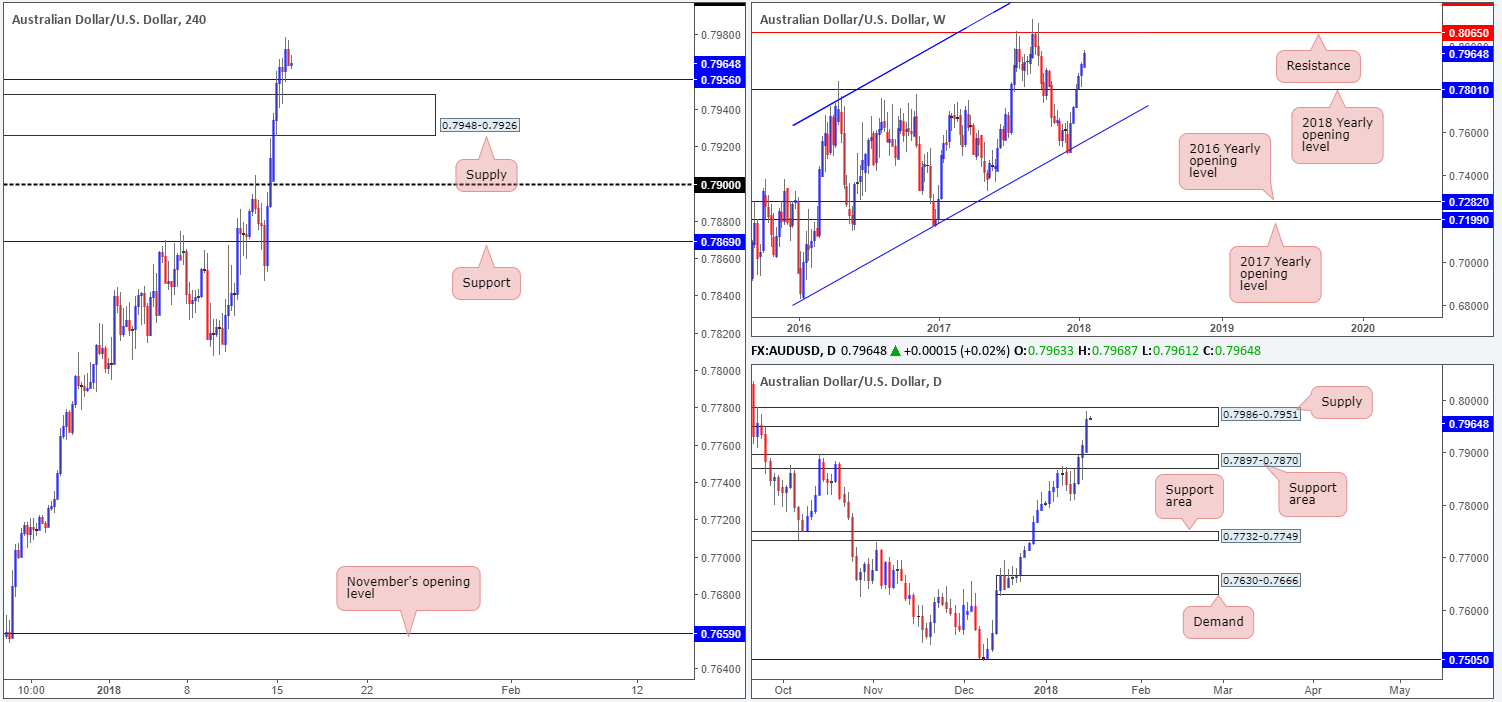
Kicking off with a quick look at the weekly timeframe, one can see that the commodity-linked currency has been on a tear since shaking hands with a weekly channel support extended from the low 0.6827 five weeks ago. Further buying is likely to place the unit within striking distance of weekly resistance penciled in at 0.8065. This level boasts a robust history so expect active sellers to make an appearance here!
Turning our attention to the daily timeframe, the recently engulfed resistance area at 0.7897-0.7870 proved to be of use as a support zone. Following Friday’s retest, the Aussie dollar extended higher on Monday in the shape of a near-full-bodied daily bull candle and ended the day crossing swords with a daily supply at 0.7986-0.7951.
Leaping over to the H4 candles, H4 supply at 0.7948-0.7926 was of little use to sellers yesterday, as was the nearby H4 resistance at 0.7956 (both now acting supports). The next area of interest on this scale is the large psychological band 0.80. A test of this level, however, would see a minor breach of the current daily supply.
Market direction:
Buying this market, although promising on the weekly and H4 charts, is not something we’d label high probability due to the aforementioned daily supply.
Selling, on the other hand, is attractive from 0.80. Assuming the number is tested, the break of the noted daily supply would likely activate stops. These stops, once filled, become buy orders. Buy orders are what’s required in order to sell. Therefore, there is a good chance that players with big pockets may be looking to take advantage of this liquidity pocket.
This setup may not trigger today, but is certainly one to keep on the watchlist, we believe.
Data points to consider: US Empire state manufacturing index at 1.30pm GMT.
Areas worthy of attention:
Supports: 0.7948-0.7926; 0.7956.
Resistances: 0.80 handle; 0.8065; 0.7986-0.7951.
USD/JPY:
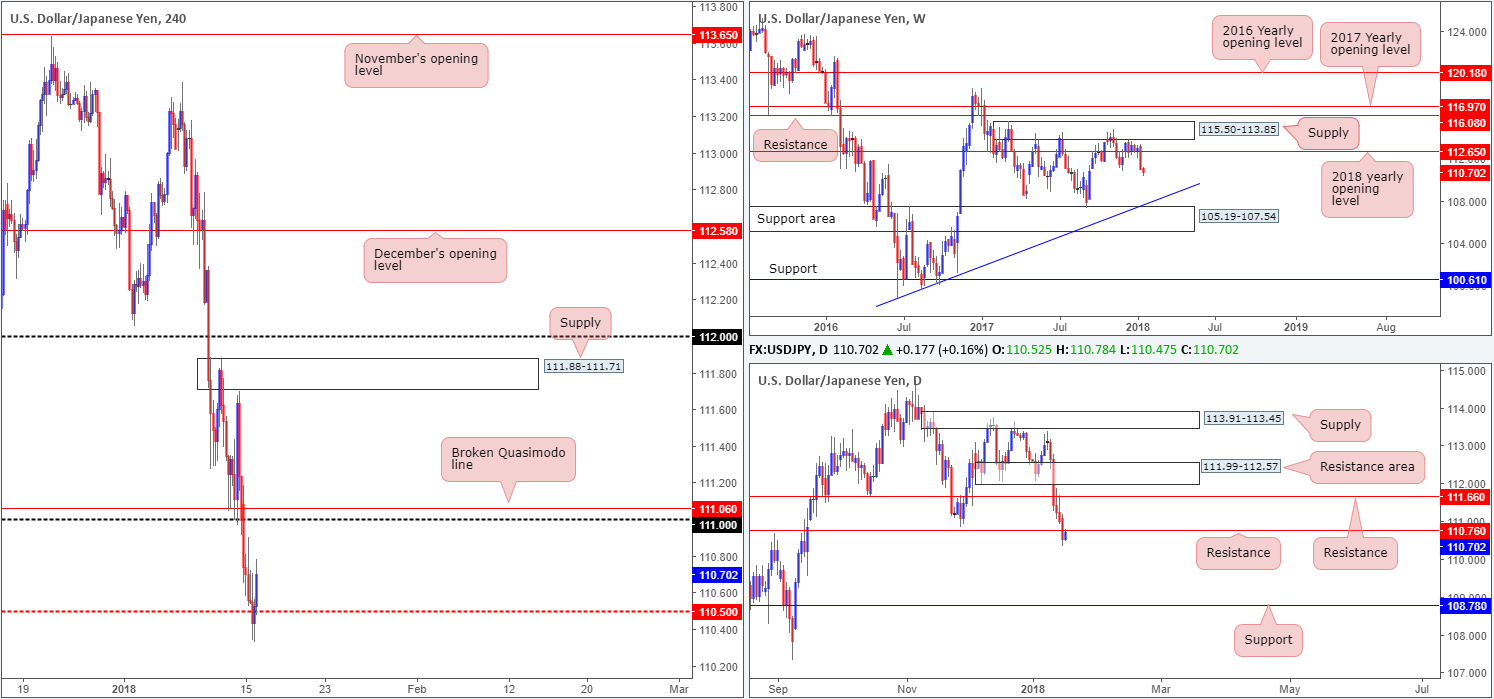
Following last week’s near-2% drop, the USD/JPY extended losses on Monday. The move, as you can see, enabled daily sellers to swallow a daily support level coming in at 110.76 (now acting resistance). Further downside from here could potentially bring the market down to daily support logged at 108.78.
H4 price concluded the session whipsawing through a H4 mid-level support registered at 110.50.
In recent minutes, we’ve seen the US dollar bulls go on the offensive, forcing the unit to retest the underside of the aforementioned daily resistance. This could, as far as we can see, hinder H4 price from reaching the 111 handle/H4 broken Quasimodo line at 111.06.
Market direction:
According to the weekly timeframe, there is little in the way of support stopping the unit from trading as far south as a weekly support area at 105.19-107.54 and a converging weekly trendline taken from the low 98.78. This – coupled with a potential reaction being seen from the noted daily resistance – could send the USD/JPY lower again today/this week.
Before a short play can be executed, though, we would like to see the 111.50 H4 level consumed, as this was an area which recently brought in active buyers.
Data points to consider: US Empire state manufacturing index at 1.30pm GMT.
Areas worthy of attention:
Supports: 110.50; 105.19-107.54; Weekly trendline support; 108.78; 110 handle.
Resistances: 110.76; 111 handle; 111.06.
USD/CAD:
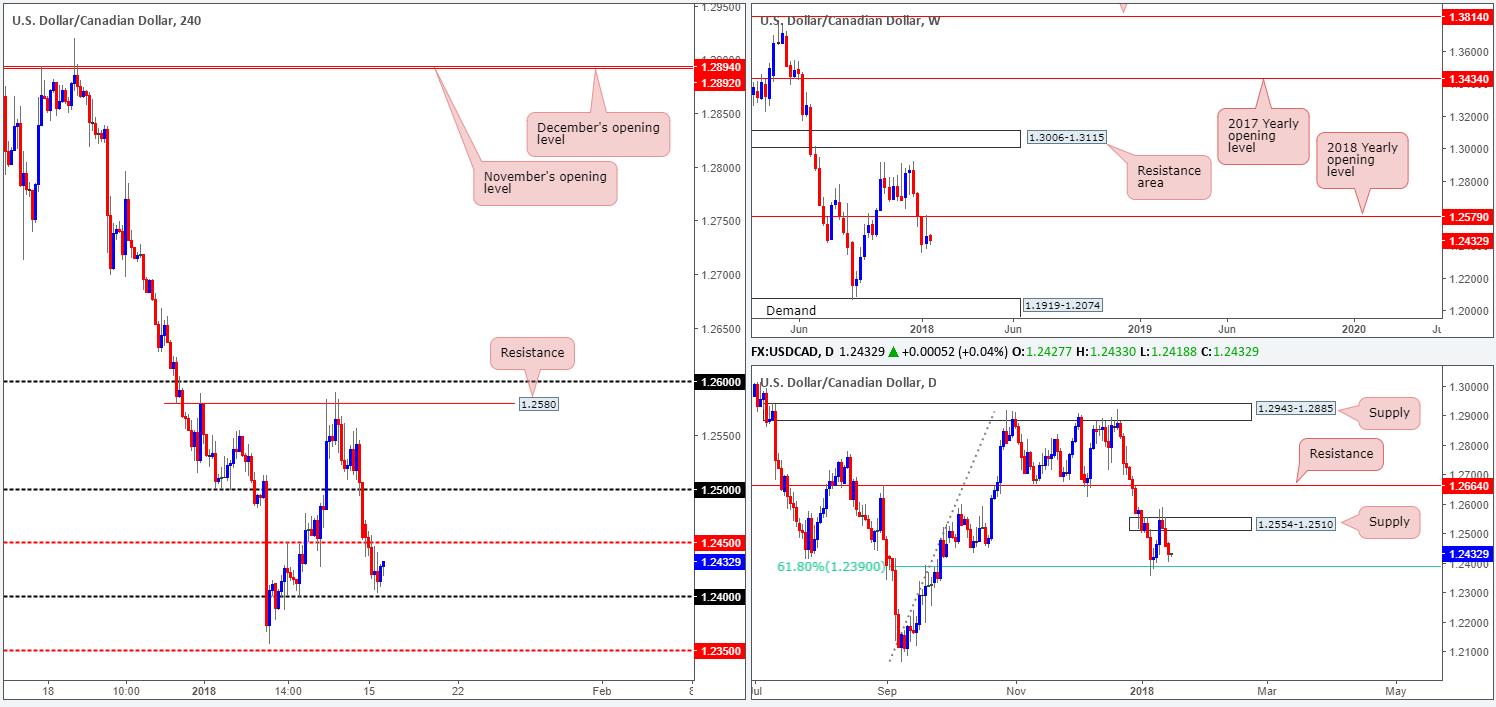
In recent sessions, we saw the USD/CAD decline lower on the back of higher crude oil prices and a weakening dollar.
According to the weekly timeframe, there’s space for the unit to trade as far south as a weekly demand at 1.1919-1.2074. Whether this selling is sustainable over the coming weeks, however, is difficult to judge. On the daily timeframe, the recent decline has brought daily price down to within striking distance of 1.2390: a 61.8% daily Fib support that proved its worth two weeks ago.
Market direction:
In spite of weekly price suggesting further downside, the 1.24 handle on the H4 timeframe and aforementioned daily 61.8% Fib support will likely be tough nut to crack. Does this mean a buy could be in order? Not necessarily. A long would also place one in direct conflict with the 1.2450 number on the H4 timeframe, and against potential weekly flow.
As such, to our way of seeing things, neither a long nor short is attractive at this time.
Data points to consider: US Empire state manufacturing index at 1.30pm GMT.
Areas worthy of attention:
Supports: 1.24 handle; 1.2390; 1.1919-1.2074.
Resistances: 1.2450; 1.25 handle.
USD/CHF:
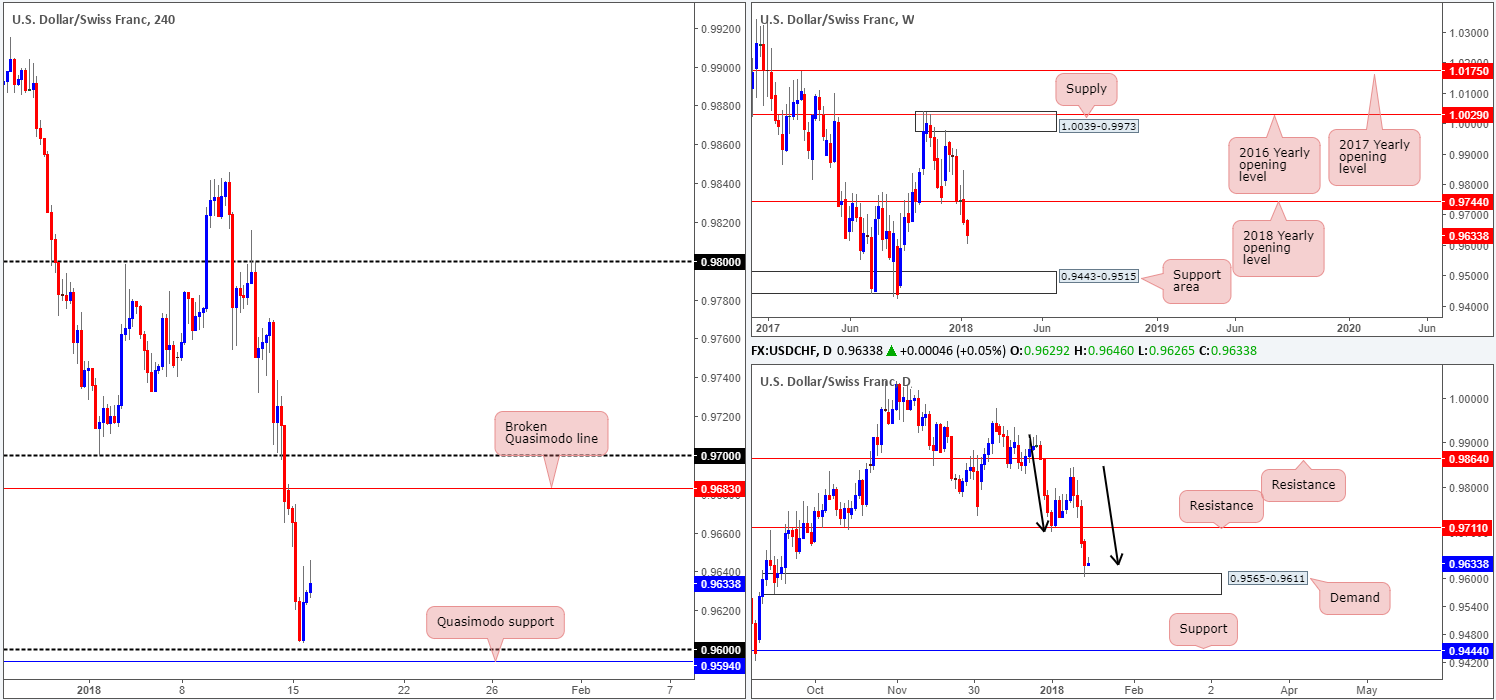
For those who read Monday’s report you may recall that we highlighted a potential sell zone around the underside of the H4 broken Quasimodo line at 0.9683 (entry would have needed to be found on the M15 timeframe though, as recommended). Well done to any of our readers who managed to jump aboard this move. H4 price extended lower and came within a few inches of the 0.96 handle/H4 Quasimodo support at 0.9594.
Turning over to the bigger picture, we can see that weekly price shows little support in the market until we reach a weekly support area located around the 0.9443-0.9515 neighborhood. Contrary to weekly action, however, daily movement recently checked in with a daily demand base at 0.9565-0.9611, and a converging AB=CD structure seen just above it at 0.9630 (see black arrows).
Market direction:
While further selling could be a possibility in this market, one has to be prepared for a potential relief rally back up to daily resistance at 0.9711. Or, more specifically, the H4 broken Quasimodo line at 0.9683/0.97 handle.
Apart from the short at 0.9683, we do not see much else on the radar right now in terms of viable trading opportunities.
Data points to consider: US Empire state manufacturing index at 1.30pm; SNB Chairman speaks today at 5pm GMT.
Areas worthy of attention:
Supports: 0.9443-0.9515; 0.9565-0.9611; 0.9575; 0.96 handle; 0.9594.
Resistances: 0.97 handle; 0.9683; 0.9711.
DOW 30:
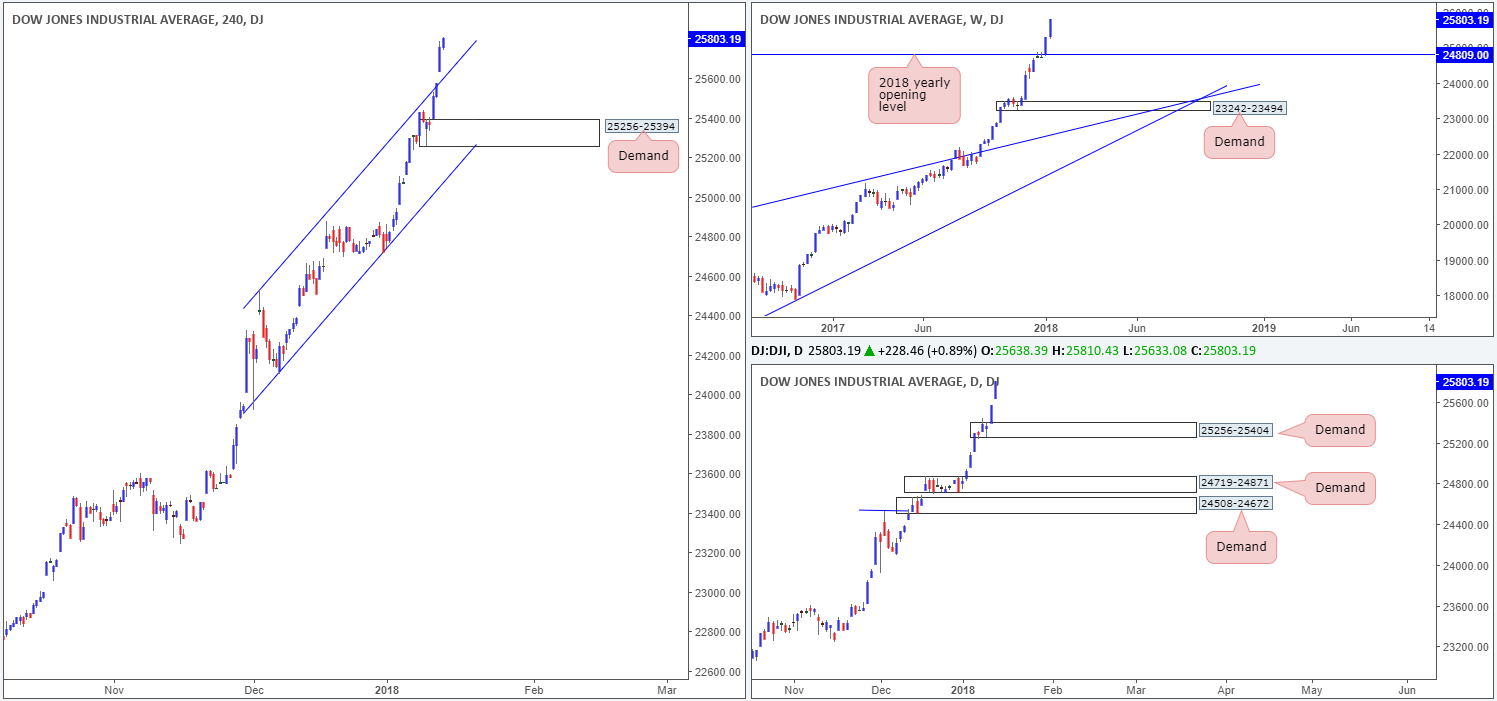
In the shape of a full-bodied weekly bull candle US equities continued to extend higher last week, registering a record high of 25810. Should the index pullback on the weekly timeframe this week, the next base of support can be seen around the 2018 yearly opening level at 24809.
Last week’s advance also formed a nice-looking daily demand base coming in at 25256-25404. This area boasts strong momentum from the base and will, in the event of a retracement, likely see a reaction.
Over on the H4 timeframe, the H4 channel resistance extended from the high 24534 was taken out. This was the last remaining obstacle stopping the unit from reaching record highs. Now that this resistance has been cleared, the engulfed line could potentially be used as platform for buyers today/this week.
Market direction:
As far as we see things, there are a few levels in the offing right now:
- Look to trade any retest seen off of the recently broken H4 channel resistance-turned support.
- Failing that, look for price to dip lower and test the H4 demand at 25256-25394. As this area is housed within the lower limits of the aforementioned daily demand, the odds of price responding from this zone are high, in our view.
Data points to consider: US Empire state manufacturing index at 1.30pm GMT.
Areas worthy of attention:
Supports: H4 channel support; 25256-25394; 24809; 25256-25404.
Resistances: …
GOLD:
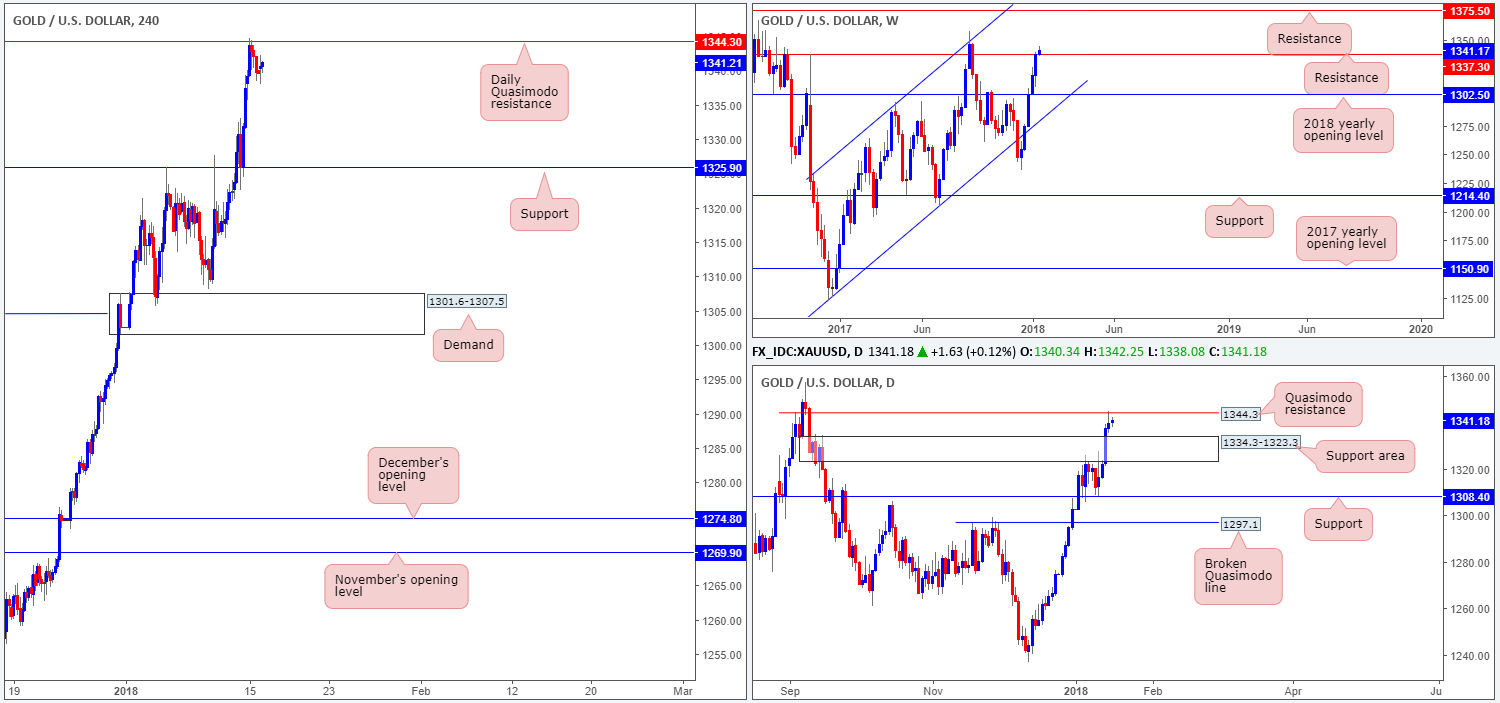
Monday’s decline seen over in the dollar market helped fuel an advance in the gold market. Pulling the unit to highs of 1344.7 allowed daily action to connect nicely with a daily Quasimodo resistance at 1344.3. Should the bears engage here, there’s a nearby daily support area to contend with at 1334.3-1323.3. On the H4 timeframe, the next downside support target does not come into view until we reach 1325.9. Adding weight to the current daily Quasimodo line is a weekly resistance seen plotted at 1337.3.
Market direction:
The weekly resistance level mentioned above at 1337.3 should be a concern for buyers, as should the daily Quasimodo resistance level at 1344.3. Given the history the weekly resistance level retains and how well defined the daily Quasimodo is, we would exercise caution if attempting to long this market on a medium/long-term basis.
So, with that in mind what about some downside? A sell from the current daily Quasimodo resistance is a high-probability level, according to the technicals being presented. Take-profit targets from this angle could be set at 1334.3 (the top edge of the daily support area), followed closely by the H4 support mentioned above at 1325.9.
Areas worthy of attention:
Supports: 1334.3-1323.3; 1325.9.
Resistances: 1337.3; 1344.3.
This site has been designed for informational and educational purposes only and does not constitute an offer to sell nor a solicitation of an offer to buy any products which may be referenced upon the site. The services and information provided through this site are for personal, non-commercial, educational use and display. IC Markets does not provide personal trading advice through this site and does not represent that the products or services discussed are suitable for any trader. Traders are advised not to rely on any information contained in the site in the process of making a fully informed decision.
This site may include market analysis. All ideas, opinions, and/or forecasts, expressed or implied herein, information, charts or examples contained in the lessons, are for informational and educational purposes only and should not be construed as a recommendation to invest, trade, and/or speculate in the markets. Any trades, and/or speculations made in light of the ideas, opinions, and/or forecasts, expressed or implied herein, are committed at your own risk, financial or otherwise.
The use of the site is agreement that the site is for informational and educational purposes only and does not constitute advice in any form in the furtherance of any trade or trading decisions.
The accuracy, completeness and timeliness of the information contained on this site cannot be guaranteed. IC Markets does not warranty, guarantee or make any representations, or assume any liability with regard to financial results based on the use of the information in the site.
News, views, opinions, recommendations and other information obtained from sources outside of www.icmarkets.com.au, used in this site are believed to be reliable, but we cannot guarantee their accuracy or completeness. All such information is subject to change at any time without notice. IC Markets assumes no responsibility for the content of any linked site. The fact that such links may exist does not indicate approval or endorsement of any material contained on any linked site.
IC Markets is not liable for any harm caused by the transmission, through accessing the services or information on this site, of a computer virus, or other computer code or programming device that might be used to access, delete, damage, disable, disrupt or otherwise impede in any manner, the operation of the site or of any user’s software, hardware, data or property.


